Internet Service Providers are almost universally despised. They've pushed for the FCC to continue defining 25 Mbps as "high use" broadband, and on top of that they overstate the quality of service they provide. A recently-released map of broadband availability in the US paints a pretty dire picture:

Here in St. Louis—where I guess I should count my lucky stars we have 'high use' broadband available—I have only two options: I can get 'gigabit' cable Internet from Spectrum, or 75 megabit DSL from AT&T.
That's it.
And you're probably thinking, "Gigabit Internet is great, stop complaining!"
But Spectrum's "gigabit" Internet is 930 megabits down—in ideal conditions—but only 40 megabits up. And that's the highest plan that costs about $150 a month!
Some would die for those speeds (see the map above), but much of the world is better off. And are you really getting the speeds you pay for? You probably don't know.
Well, I do, thanks to a $35 Raspberry Pi! And you don't even need a Pi, you could run the software I use on any computer. I just like having a dedicated computer to run all my Internet connection tools, so it's easy to backup or replace, and it doesn't get bogged down.
Video
I have a video that goes along with this blog post, and it's embedded below; skip past it if you prefer reading over viewing.
My Internet Pi
This is my "Internet Pi" (hostname geerli.net):

I have it installed in a rack (here's a video on the Pi rack), but it could just as easily be on my desk, or sitting by my Internet router.
The most important thing for measuring a network connection is that it's wired. WiFi, especially on the Pi, fluctuates quite a bit and is terrible for monitoring anything besides maybe WiFi signal strength.
The Internet Pi runs Pi-hole for DNS privacy and ad-blocking, and Prometheus and Grafana to provide Internet connection monitoring dashboards.
Having a Pi monitoring my Internet continuously makes it easy to see trends over time, or confirm outages. If you just spot check by running a Speedtest every now and then, you don't have much data to go on.
Setting up Internet Pi
I built the free and open source internet-pi project on GitHub. It's simple to set up, and you can choose which parts of the platform you want to use.
I set up my Internet Pi from another computer, but you could also run the Internet Pi playbook on the Pi itself. Following the install instructions, you need to have a Pi set up with Raspberry Pi OS running on your network, and be able to SSH into the Pi.
Here are the steps to get it going:
- Make sure you have Ansible installed:
- (If
pip3is not installed)sudo apt-get install -y python3-pip pip3 install ansible
- (If
- Download the internet-pi repository to your computer:
git clone https://github.com/geerlingguy/internet-pi.git && cd internet-pi - Install the Ansible Galaxy content that's required to make the playbook work:
ansible-galaxy install -r requirements.yml - Make copies of the
example.inventory.iniandexample.config.ymlfiles (dropping theexample.from the filenames) and modify them for your own needs - Run the playbook:
ansible-playbook main.yml
The playbook installs all the tools you choose in your configuration file, and once that's done, you should be able to access your Pi's IP address in a web browser to see Pi-hole, or visit the IP address with the port :3030 on the end to see the Grafana dashboards.
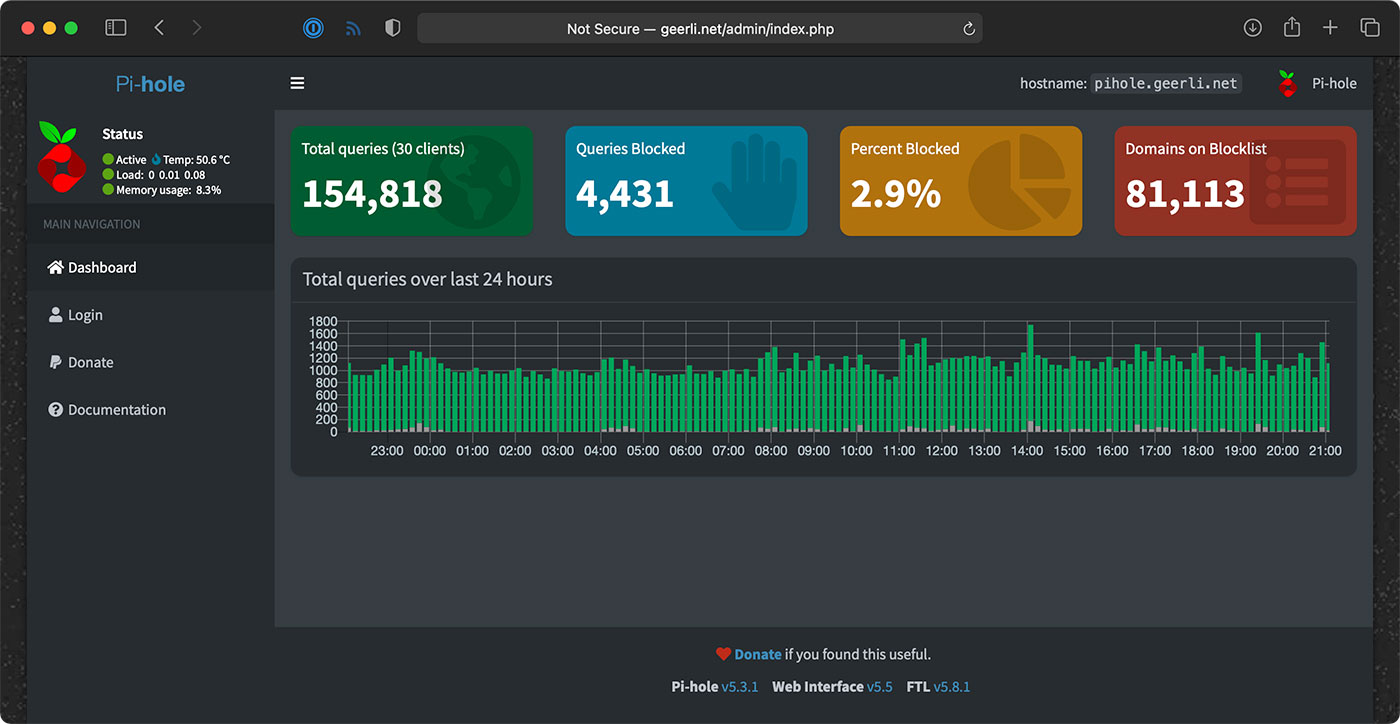
Setting up Pi-hole
If you wanna use Pi-hole as your home network's DNS server, you should configure your router to advertise the Pi's IP address as the primary DNS server for your whole home network. For extra redundancy, you could actually configure two Pis running Pi-hole, but that's a topic for another post!
But the great thing is, that allows you to see all the DNS requests your devices are making, and make sure (for the most part) things like so-called 'smart' TVs don't send tons of information to advertisers.
Pi-hole is a great first line of defense for your Internet privacy, at least at home, and it even has some other neat tools like a simple DNS server, if you want to use them.
Internet monitoring
The Internet monitoring dashboard is automatically configured for you, but it can take up to an hour before you start seeing data.
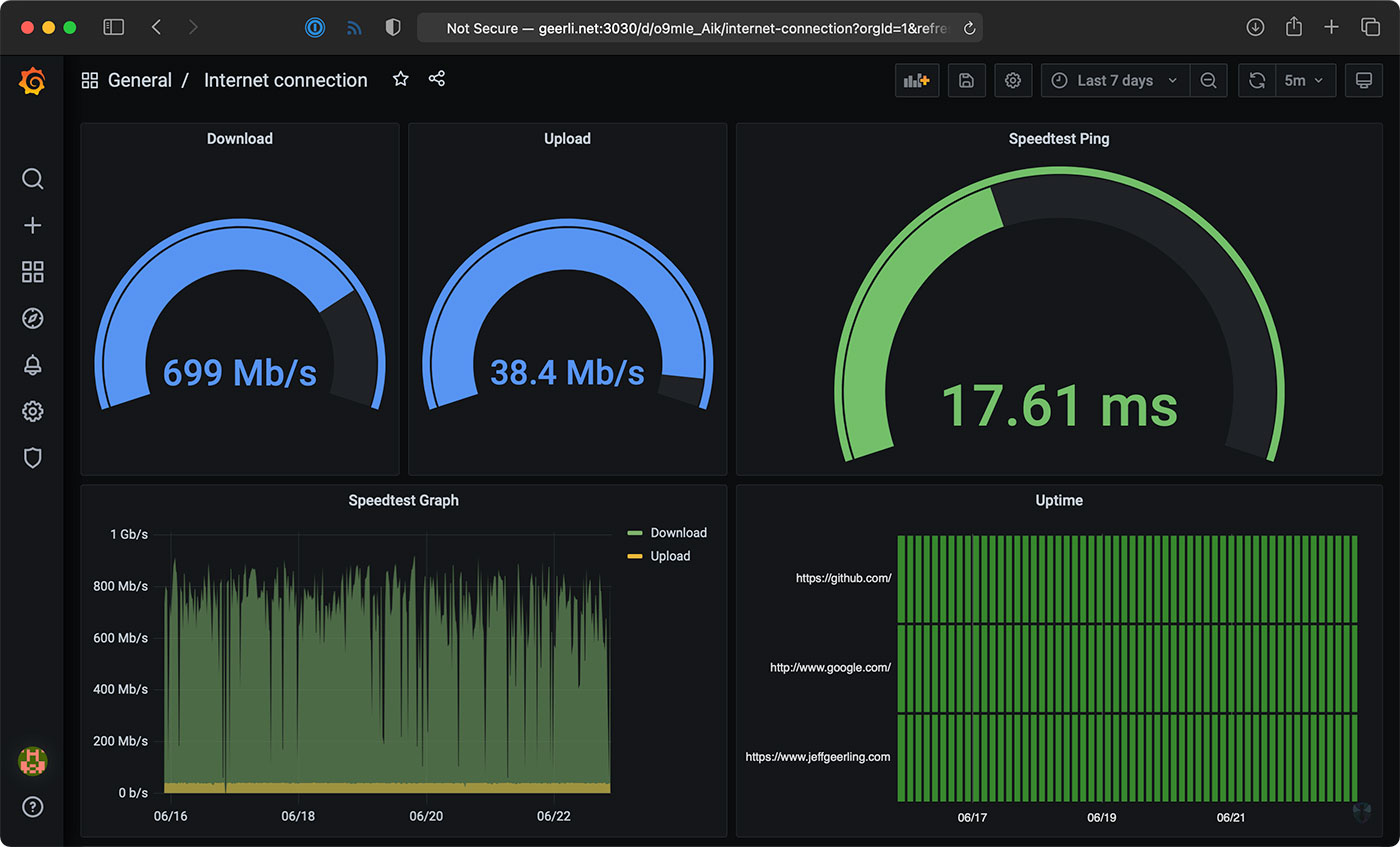
In my case, it's been running for a couple months, so I can see the Internet connection for the past day, week, or even longer!
The monitoring configuration runs one container that connects to Speedtest.net. Every 30 minutes or so, another container running Prometheus tells the first container to run a speed test.
NOTE: If you run this monitoring on your own network, be aware that these Speedtest.net checks will consume a good amount of data, especially if you run them more frequently. If you have data caps and want to use this monitoring solution, make sure to modify the check interval so you don't get an unexpected overage. ISPs, gotta love 'em!
It stores that data on the Pi, and the Grafana dashboard displays it over time. There's another service that does simple checks on websites you can configure for uptime and HTTP request timing stats—those lightweight checks are performed every few seconds, to give a detailed view when there is more latency in your Internet connection.
One thing I found interesting was my Cable internet connection—which is supposed to be one 930 Mbps—is only really about 700 Mbps on average.
Upload speeds are more consistent, so I begrudgingly pay for this high-tier plan... But I'd be a lot happier with 50 or 100 Mbps of asymmetric data, since I'm not downloading terabytes of files every day.
Starlink monitoring
The main reason I set this stuff up was to compare my Gigabit Cable Internet to SpaceX's Starlink Internet.
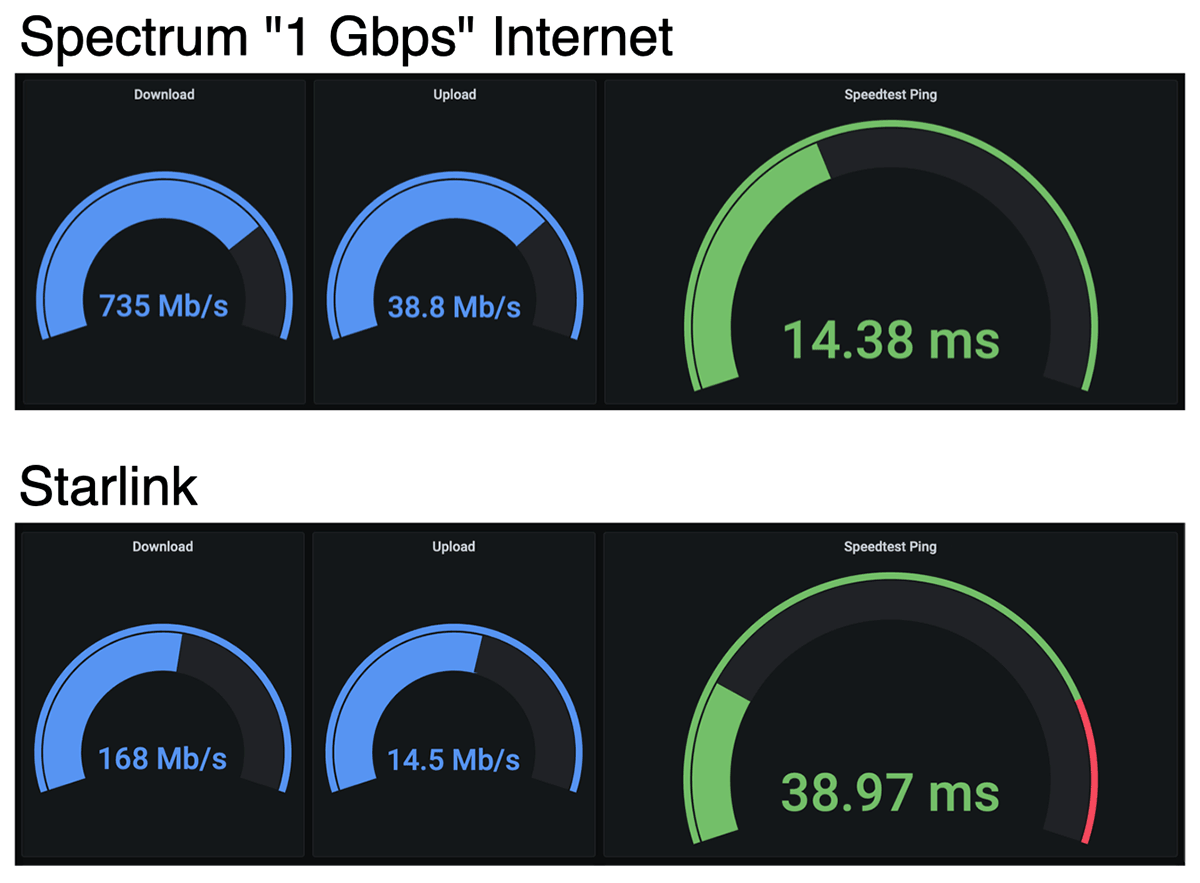
I'll get more into Starlink in a future review, but it looks like on average, when it has a stable connection, I get over 150 Mbps down, and 15 Mbps up, with 40 milliseconds of latency.
Those numbers are less than my Cable ISP; but Starlink also costs less—it's $99/month. And Starlink is also beaming the Internet through satellites up in the sky! For someone who doesn't have a fast Cable option (like rural customers), that's a mind-blowing upgrade from dial-up speeds.
But I mentioned earlier, there's also a Starlink-specific dashboard that gives all the details you'd normally find in the Starlink App.
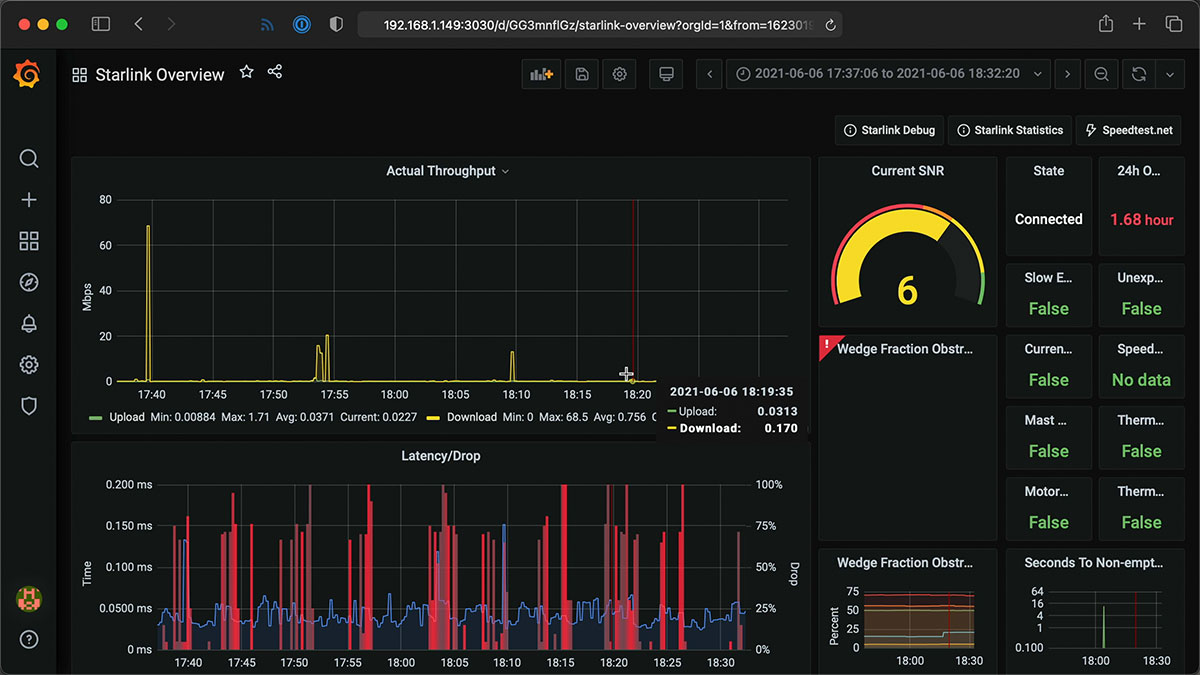
I haven't been actively using the Starlink connection today, so it's a little barren, but it gives a ton of detail, and I'd like to thank Daniel Willcocks (DanOpsTech) for making this possible; I'm using his Docker image and dashboard, and he even adjusted it to work on the Raspberry Pi after I asked about it!
Power monitoring
I also monitor Starlink's power consumption using a Shelly Plug US and a custom Shelly Plug Prometheus exporter I wrote:
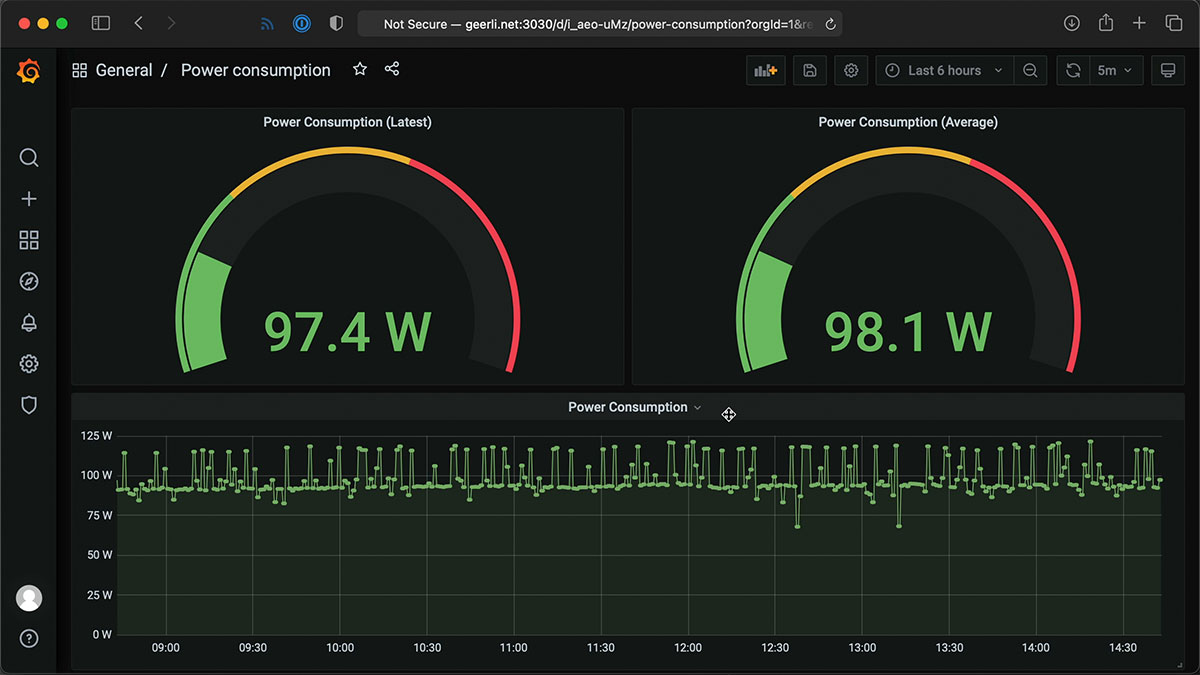
Starlink's dish and router use a lot of power (more than you might expect)—but I'll discuss more about that in my Starlink review coming soon! I have a blog post with more about how I set up the Shelly Plug power monitoring.
Conclusion
Now I know exactly how much my ISP is fleecing me for Internet. In Spectrum's case, it looks like they're only giving me about 3/4ths of what I pay for.
I wish I could just pay them $110 a month instead of $150, but if I did that, they'd cancel my service!
I'd like to thank Max Andersen for the original inspiration for the original monitoring configuration, the developers behind Pi-hole for making it free and open source, and especially Miguel who maintains the speedtest exporter, for his help getting some bugs fixed!
Comments
Excellent! Not sure how to interpret my results though, "web request durations" spiking up to 5 seconds is bad correct? https://i.imgur.com/CpSSX7h.png I'm trying to diagnose intermit issues where webpages stall out for long periods.
Hi Jeff
I have just discovered your content and have watched quite a few. I decided to give this one a go as start and have got most of it done but now see this
TASK [Ensure {{ ansible_user }} user is added to the docker group.] **********************************************************************
fatal: [127.0.0.1]: FAILED! => {"msg": "The task includes an option with an undefined variable. The error was: 'ansible_user' is undefined\n\nThe error appears to be in '/home/guardadmin/internet-pi/tasks/docker.yml': line 58, column 3, but may\nbe elsewhere in the file depending on the exact syntax problem.\n\nThe offending line appears to be:\n\n\n- name: Ensure {{ ansible_user }} user is added to the docker group.\n ^ here\nWe could be wrong, but this one looks like it might be an issue with\nmissing quotes. Always quote template expression brackets when they\nstart a value. For instance:\n\n with_items:\n - {{ foo }}\n\nShould be written as:\n\n with_items:\n - \"{{ foo }}\"\n"}
I checked the docker.yml and it seems correct
- name: Ensure {{ ansible_user }} user is added to the docker group.
ansible.builtin.user:
name: "{{ ansible_user }}"
groups: docker
append: true
Any thoughts?
How do I get past error when I run the playbook?:
TASK [Ensure apt cache is up to date.] *****************************************
fatal: [127.0.0.1]: FAILED! => {"changed": false, "msg": "Failed to update apt cache: W:This must be accepted explicitly before updates for this repository can be applied. See apt-secure(8) manpage for details., E:Repository 'http://raspbian.raspberrypi.org/raspbian buster InRelease' changed its 'Suite' value from 'stable' to 'oldstable', W:This must be accepted explicitly before updates for this repository can be applied. See apt-secure(8) manpage for details., E:Repository 'http://archive.raspberrypi.org/debian buster InRelease' changed its 'Suite' value from 'testing' to 'oldstable'"}
It looks like PiHole added a new feild that need to be processed into it. The "default_ivp4" variable. Here is my error:
Traceback (most recent call last):
File "/home/pi/.local/lib/python3.9/site-packages/ansible/plugins/action/template.py", line 138, in run
resultant = templar.do_template(template_data, preserve_trailing_newlines=True, escape_backslashes=False)
File "/home/pi/.local/lib/python3.9/site-packages/ansible/template/__init__.py", line 1131, in do_template
raise AnsibleUndefinedVariable(e)
ansible.errors.AnsibleUndefinedVariable: 'dict object' has no attribute 'default_ipv4'
fatal: [127.0.0.1]: FAILED! => {
"changed": false,
"msg": "AnsibleUndefinedVariable: 'dict object' has no attribute 'default_ipv4'"
}
PLAY RECAP **************************************************************************************************************************************************************************
127.0.0.1 : ok=13 changed=0 unreachable=0 failed=1 skipped=8 rescued=0 ignored=0
I'm not a YAML guy, but I'm willing to try if I can find the right file to add the dict_obj to.
My bet is the all the PiHole projects need this now with the latest release..
Everything seems to work fine except that it doesn't start automatically after reboot of Pi...
Any suggestions?
Raspi4B, 4GB
Latest RspberryPi OS
Wired connection
The speedtest results are nowhere near what I get using speedtest-cli. This is my typical cli result:
➜ ~ speedtest
Speedtest by Ookla
Server: Tampa Bay Fiber - Tampa, FL (id = 17026)
ISP: Comcast Business
Latency: 19.20 ms (0.06 ms jitter)
Download: 941.98 Mbps (data used: 1.5 GB)
Upload: 934.34 Mbps (data used: 1.1 GB)
Packet Loss: 0.0%
However the dashboard has a max up of 277 and down of 210. I tried both with no server specified and with the 17026 specified. It makes no difference. Why does running it in docker kill the speeds? At least it lets me know my connection is alive, but there is zero accuracy to the results. How can I troubleshoot this? I know nothing about how Prometheus or Grafana work.
Not sure if anyone has the same experience, but started using this last month and noticed that my data usage from Xfinity shot WAY up; To the point that I overran their data cap (~1.2TB). I happened to be out of town over the first of the month and noticed Xfinity had used over 200GB of data while I was still away in the new billing cycle. As soon as I disabled the Internet Pi, the usage stopped. I do have ~1Gb down, but never expected that kind of consistent throughput.
Another question that I can't figure out:
Is there a way to reset the statistics (without re-install)?
Could someone please supply a list of *all* services that could/should be stopped to stop/pause monitoring (not Pi-Hole) entirely.
( sudo systemctl stop )
Big THANKS in advance!!
You state this could run on any computer. I have an old MacBook. Could you point me to directions on setting up a MacBook to monitor my internet?note I am no computer programmer but I can follow directions (chem eng by degree). Tho this would be a good reason to get a pi and tinker a bit....
To run it on a Macbook (Intel CPU, I would guess), you'd need to run a virtualized Linux environment. You'd need to download VirtualBox, set up maybe an Ubuntu 22.04 installation in a new VM, and then run the setup instructions inside that VM.
Hopefully this is a quick question - is there a way to keep more than 2 weeks data? Whenever I login to Grafana it only shows me the latest 2 weeks? Thanks
Hi Jeff,
hope you are feeling better.
Would it be possible to explain how to add a Docker of Unbound to your build, I have tried but I am in a muddle.
I think adding in an upstream Unbound to the PiHole would make things even better.
I got your system working OK but I tried this and failed when trying to add in form this
https://fictionbecomesfact.com/unbound-container
Thanks
Fred
Hi Jeff. I hope you're feeling better. I'm not able to authenticate to Grafana anymore and don't recall setting a PW. I've seen a couple of procedures online for resetting the PW via CLI but they don't seem to work. Can you offer any insight?
Thanks,
-Rob
I've been looking for a way to monitor my ISP (Comcast) and track how often the internet drops. I've spent most of the day attempting to get this to work.
I cannot get the ansible-playbook to finish as it comes up with a pip and rust error.
I think a new, super detailed video is in order. If that's possible, I think a lot of the people having issues would appreciate it.
I am getting this when running the playbook ...
pi@raspberrypi:~/internet-pi $ ansible-playbook main.yml
[WARNING]: Unable to parse /home/pi/internet-pi/inventory.ini as an inventory
source
[WARNING]: No inventory was parsed, only implicit localhost is available
[WARNING]: provided hosts list is empty, only localhost is available. Note that
the implicit localhost does not match 'all'
[WARNING]: Could not match supplied host pattern, ignoring: internet_pi
PLAY [internet_pi] *************************************************************
skipping: no hosts matched
PLAY RECAP ***************************************************
Any help for a total n00b plz ? :
The official Ookla Speedtest-CLI is up to version 1.2.0.84. The one in the docker container is 1.0.0.2. Any way I can update this in the docker container? I am not too familiar with docker. I ask because the 1.2 version seems better at picking a better performing server in the Speedtest network. The 1.0 version likes picking a server in another state and I get a third the performance. It does this over half the time. Thanks much.
I keep getting this error
HELP PLEASE
Building wheel for bcrypt (PEP 517): finished with status 'error'\nFailed to build bcrypt\n\n:stderr: ERROR: Command errored out with exit status 1:\n command: /usr/bin/python3 /tmp/tmp8a4e6zfx_in_process.py build_wheel /tmp/tmp1wu9g4dz\n cwd: /tmp/pip-install-zaj39q1u/bcrypt_37acdb3bfa4642f498d50f7cedd21f95
Did you solve this problem? I am getting a similar error. So far I have updated/Upgraded Pi OS and PIP. I have manually installed Rust as that is what seems to be processing bcrypt, but still same error.
I eventually installed docker-compose with apt using
sudo apt install docker-compose
Now I have an error: fatal: [127.0.0.1]: FAILED! => {"changed": false, "msg": "Error connecting: Error while fetching server API version: ('Connection aborted.', PermissionError(13, 'Permission denied'))"}
Off to look for a fix to that one now
I have tried loading this software on a Raspberry Pi with the latest OS installed and keep getting this error
TASK [Ensure internet-monitoring environment is running.]
fatal: [127.0.0.1]: FAILED! => {"changed": false, "msg": "Error connecting: Error while fetching server API version: ('Connection aborted.', PermissionError(13, 'Permission denied'))"}
Can you direct me to a solution to this problem.
I love the concept of this project! As ISP owner/operator I was wondering if it is possible to have multiple monitoring boxes placed at selected points throughout my network to help me be more proactive about finding bandwidth and latency issues. I would really love to help further this project with funding and collaboration. It is possible to be an ISP and be noble and proactive in your efforts and intentions.
Hi ! Does this error mean anything to you?
My installation went well, I think I configured the inventory.ini file correctly, but I can't.
TASK [Install Docker Compose using Pip.] ***************************************
fatal: [127.0.0.1]: FAILED! => {"changed": false, "cmd": ["/usr/bin/pip3", "inst all", "docker-compose"], "msg": "stdout: Looking in indexes: https://pypi.org/si
I'm getting the exact same issue. Really annoying
Check out the followin for help. Basically install docker compose youself, stop the service and run the ansible install again.
https://github.com/adriankumpf/teslamate/discussions/2881
How would I install for a network running verizon?
Hi jeff and thank you for your work !
i can tun internet pi on rasbp pi 4 but on mi Pi ZeroW i always get this message during install:
fatal: [192.168.1.29]: FAILED! => {"changed": false, "errors": [], "module_stderr": "", "module_stdout": "", "msg": "Error starting project 500 Server Error: Internal Server Error (\"Get \"https://registry-1.docker.io/v2/\": net/http: TLS handshake timeout\")"}
Is there anything i mess in my config file ?
Thank's a lot !
Hi,
I try to install this on a vm with Debian and i try to run ansible-playbook main.yml i got an error: Failed to connect to the host via ssh: [email protected]: Permission denied.
Where can i specify the right credentials?
you will need to setup a ssh trusts
myusername:~ ssh-keygen -t rsa
myusername:~ ssh-copy-id [email protected]
this will copy your public key to the remote host 192.168.81.1
then ansible can connect without errors.
I installed the project, and after working through a couple of issues, I could get Grafna to let me log in, but there were no graphs showing. I'm at a loss because the last thing I did without errors was run the install command again with passwords required to get past a permission error near the end. All worked successfully. I've rebooted the server to clear anything pending install. Can you tell me how to get the graphs installed?
You need to go to the 'Dashboards' section then 'Browse' to get to the dashboards that display data. And some of them may take 30+ minutes before you'll start getting data in.
Im not sure what is going on. I tried following the steps using raspian and couldnt get past step 2.
Installed Ubuntu instead on my pi and when I run "ansible-galaxy install -r requirements.yml" step I get this:
pi@ubuntu:~/internet-pi$ ansible-galaxy install -r requirements.yml
Traceback (most recent call last):
File "/usr/bin/ansible-galaxy", line 66, in
from ansible.utils.display import Display, initialize_locale
ImportError: cannot import name 'initialize_locale' from 'ansible.utils.display' (/home/pi/.local/lib/python3.10/site-packages/ansible/utils/display.py)
I managed to get it running on an x86 machine fine, just not working for me on the pi using raspian or ubuntu server. I got past the last error that I posted but now docker is having errors when running the script with the last command.
I have a similar issue. Its trying to run a script or a docker as 32bit but not finding what it needs. I'll post the error later. Did you ever find a solution?
Nope, didnt get it working and gave up. Should have clarified that I got it working on a 64bit x86 machine but yeah seems to do with installing it on 32bit machines.
I'm having trouble getting unbound working. Installed, tested with dig and it's resolving. When I use 127.0.0.1#5335 in pi hole, no websites will resolve. Any tips?
Answering my own question (sort of). Since Pi-hole is running in a container, installing unbound on the PI isn't going to work. Chris Crowe has a configuration to install unbound and Pi-hole in the same container https://github.com/chriscrowe/docker-pihole-unbound/tree/main/one-conta… but it would require rolling up your sleeves and integrating that configuration into Jeff's
Hi, considering the current pi availability, can we run pi hole, network monitoring and a NAS setup via a single pi?
I understand NAS needs all the RAM it can, how much do pi hole and network monitoring need?
Is there a way to monitor Starlink when the router is in bridge (bypass) mode?
What if I just want to add this to my existing pihole? I'm thinking it'd be best to install your script thingie to a new microsd and install that into the pi-hole pi.
My pi-hole is running on a 1b (I think it is. It's from 2014). Is that going to be enough oomph for this?
Jeff,
I am trying to install this and getting the following error:
fatal: [127.0.0.1]: FAILED! => {"changed": false, "cmd": ["/usr/bin/pip3", "install", "docker-compose"], "msg": "stdout: Looking in indexes: https://pypi.org/simple, https://www.piwheels.org/simple\nCollecting docker-compose\n
PIP version is
pi@4GB-OP25-PiHole:~/internet-pi $ pip --version
pip 22.3.1 from /home/pi/.local/lib/python3.9/site-packages/pip (python 3.9)
Ansible version is
ansible [core 2.14.1]
config file = /home/pi/internet-pi/ansible.cfg
configured module search path = ['/home/pi/.ansible/plugins/modules', '/usr/share/ansible/plugins/modules']
ansible python module location = /home/pi/.local/lib/python3.9/site-packages/ansible
ansible collection location = /home/pi/.ansible/collections:/usr/share/ansible/collections
executable location = /home/pi/.local/bin/ansible
python version = 3.9.2 (default, Mar 12 2021, 04:06:34) [GCC 10.2.1 20210110] (/usr/bin/python3)
jinja version = 3.1.2
libyaml = True
All the installs seemed to work fine but when I run the
ansible-playbook main.yml
I get the above error
Jeff, the tutorial was great, even for a linux\RPI beginner. I got it to work and wondered why it was reporting half of my download speed. Then I saw your notes about using an RPI 4 because the 3b+ only has a 300Mb connection due to using USB2. RPI 4 is out of reach, would I be able to run RPI os and this setup on Virtualbox on Windows and still have reliable data? Or is there a better option I haven't thought of?
I have been attempting to recreate Jeff Geerlings very cool network monitor project.
I have managed to get this far, localhost only, and graphana only but not configured panels.
I have some experiance with raspberry pi in general but do not no anisble, docker or graphana at all.
I have not been able to get pihole working this way tho I have done several installs direct on pi4 and pi3b hardware so I am not as concerned with that.
Any thoughs?
Jeff,
Great article. and overview. I have a few queries -
- I have instance of PiHole already up and running as a container in my host. And I did see you mentioning that we can change the flag to 'false' if we don't want to install PiHole. So, thanks for that.
- I also have a Grafana and Prometheus installed into two containers that I am using to monitor the stats off my host and dashboard it. Is there any way for me to just add scrape-operation and dashboarding to the existing instances rather than spinning up a new one?
I would really appreciate it if you can point me in the right direction.
I noticed that the version of prometheus is out of date. Is there any easy way to update it? I tried following some tutorials online, but when I run the ansible playbook again, the outdated image starts running again.
Jeff - Great article and very interesting project. Seems like many have tried to put it together with varying degrees of success. Have you considered turning this into a Docker container in order to make it more readily available?
So, I have PFSense failing over and load balancing my fiber and StarLink. My main LAN uses the fiber as gateway, and I have starlink for 3 of my VLANs. Evidently, everything is set up to failover to the working WAN when their gateway drops.
Since I have my Pi in my main LAN, it cannot see my Starlink. My Starlink IP is 192.168.1.1 (changed from 192.168.100.1), and I made the changes to the "starlink-overview.json":
"links": [
{
"icon": "info",
"tags": [],
"targetBlank": true,
"title": "Starlink Debug",
"tooltip": "",
"type": "link",
"url": "http://192.168.1.1/support/debug"
},
{
"icon": "info",
"tags": [],
"targetBlank": true,
"title": "Starlink Statistics",
"tooltip": "",
"type": "link",
"url": "http://192.168.1.1/support/statistics"
},
Does anyone know what I would need to change in PFSense to allow my Pi to see my StarLink?
These are my assigned interfaces:
Interface Network port
wan_Claro igb0 (40:xx:xx:xx:xx:cd) 10.0.0.1
LAN igb1 (40:xx:xx:xx:xx:ce) 192.168.0.0/24
Kate_VLAN VLAN 15 on igb1 - lan (Kate and Mercedes) 192.168.15.0/24
IoT_LAN VLAN 55 on igb1 - lan (IoT) 192.168.55.0/24
Kids_VLAN VLAN 25 on igb1 - lan (Kids) 192.168.25.0/24
Media_VLAN VLAN 45 on igb1 - lan (Media and Games) 192.168.45.0/24
Guest_VLAN VLAN 75 on igb1 - lan (Guest) 192.168.75.0/24
StarLink_WAN igb2 (40:xx:xx:xx:xx:cf) 192.168.1.1
Grafana dashboards are live and working, but the StarLink Overview shows everything at 0 and shows this error:
There's an error in your script :
TypeError: Cannot read properties of undefined (reading 'fields') - line 3:28 (Check your console for more details)
I tried NATting 1:1, port forwarding (allowing all ports) and creating an outbound rule, rebooted the pi every time I made a change, nothing seems to work.
Sorry if I'm asking for something that should be evident and I'm missing it.
Thank you.
Hi Jeff. I've got a new RP1 4B, 4GB. Install went without major issues, but when I start the Ansible playbook, everything looks good until the [Ensure internet-monitoring environment is running.] I get a FATAL: [127.0.0.1]: FAILED! => false, "msg": "Error connecting: Error while fetching server API version: ('Connection aborted.', PermissionError(13, 'Permission denied'))")
Did I do something wrong when editing the config yml?
Thanks
I should add that I've rebooted several times and retried the playbook, but always keep getting the same error fetching the API version.
Not sure what changed since last night, but the playbook loaded this evening and the dashboards are showing up. I echo one other responder in that the speedtest-cli reported speeds are not accurate. I pay for gig service and using Ookla standard test, the pi reports speeds in the high 800's or 900's. Speedtest-cli in this program and when I run it manually only report about 120 MBps. I've had this problem before in my own internet monitor (Instructables The Internet Monitor) and I've been trying to find a solution. None so far.
Well, I'm surprised, because the first speedtest showed results approaching my gigabit speeds. I'd love to know what is different since this uses speedtest-cli, but I'm not complaining. Well done and thanks Jeff.
Unfortunately I am getting a permission error:
TASK [Ensure internet-monitoring environment is running.]
fatal: [127.0.0.1]: FAILED! => {"changed": false, "msg": "Error connecting: Error while fetching server API version: ('Connection aborted.', PermissionError(13, 'Permission denied'))"}
when I run ansible-playbook main.yml" I get one error: TASK [Ensure internet-monitoring environment is running.] **********************
fatal: [127.0.0.1]: FAILED! => {"changed": false, "msg": "Error connecting: Error while fetching server API version: ('Connection aborted.', PermissionError(13, 'Permission denied'))"}"
Any idea how to fix this?
Hi Jeff.
Great content, I am getting the message below, currently using a Pi3 model B. Any idea what could be ?
TASK [Ensure internet-monitoring environment is running.] **********************
fatal: [127.0.0.1]: FAILED! => {"changed": false, "errors": [], "module_stderr": "", "module_stdout": "v2.25.2: Pulling from prom/prometheus\n", "msg": "Error starting project failed to register layer: error creating overlay mount to /var/lib/docker/overlay2/fb5e25744d6fe1e4d667ac42f72ca96a6a8a2a1f1e66a657650b51745bd8d525/merged: too many levels of symbolic links"}
I encountered the exact same problem. I have overcome this through installing Prometheus manually. I have followed this https://pimylifeup.com/raspberry-pi-prometheus/ to get the prometheus installed. And then I re-run "ansible-playbook main.yml" again and the problem was resolved.
Thanks for great packaging Jeff!
I have one question that I cant find a solution to:
Is there any way clear all (or partial) statistics data and/or history without re-installing everything?
Thank You!
Jeff is there anything specific that needs to be done to enable DHCP on the Pi? I disabled DHCP on my router and enabled it on PiHole, and I get no IPs assigned an loose all internet. Thoughts?
Jeff,
I am trying to install this, but keep getting the following message. The user name for my Pi is john
I am sure that is what is causing the issue, just not sure how to fix it.
Any help would be greatly appreciated.
Thanks
TASK [Ensure internet-monitoring environment is running.] **********************************************************************************
fatal: [192.168.1.210]: FAILED! => {"changed": false, "msg": "Error connecting: Error while fetching server API version: ('Connection aborted.', PermissionError(13, 'Permission denied'))"}
Restart did the trick for me at least.
Hi Jeff,
I am an absolute novice at Linux and bought a Pi for the sole purpose of monitoring network uptime and obtaining ad block capability. Thank you so much for putting this together!
I have a question on the Pi-hole front: I have the internet monitor pinging external sites every 5 seconds. I have observed that these pings come from an IP address on the Pi (172.20.0.1) and get logged on Pi-hole. Since it is five sites every five seconds, my connection stats skew heavily on this address. Is there a way to exclude this IP from Pi-hole's statistics?
*RESOLVED*
In case anyone is looking for similar results, I was modified docker-compose.yml. Under the "ping" section, I added
dns:
- 8.8.8.8
After saving, I ran "docker-compose up -d" from within the same directory as docker-compose.yml.
Hi Jeff,
First thanks for your great job!
I am not super in linux and I have mainly used the Pi for hosting Pi-hole, but now wanted to monitor my ISP, which thanks you I can now.
I have encountered a small issue.
When I do http://localhost:9090/targets to see status of monitored targets I get for Pihole the status to be "down" while Pihole is running and this error:
Get "http://pihole:9617/metrics": dial tcp: lookup pihole on 127.0.0.11:53: no such host
How to solve?
help pls
" ansible-galaxy install -r requirements.yml
bash: ansible-galaxy: command not found"
really interested in seeing if this will shed some light on a connection issue i'm having at random times but i'am a newb and something appears to not be working
Just a common warning/notice!!:
Installation on 'bookworm' will fail. Command 'pip3 install ansible' can't be excuted!
Sorry but I didn't have possibility to catch the error... :-(
Hello Jeff,
Which Pi did you use to make this setup? Was it the 4 with 2, 4 or 8GB ram?
Will this also work on a Pi 5? And how much ram fo you advise, 4 or 8GB?
Thank you in advance.
Best regards,
Timothy
I've been running it on a Pi 4 with 4 GB of RAM. I'd recommend that or 8 GB, just so it doesn't have to swap data to disk as much. It shouldn't normally, but it is much less likely with more RAM.
It should work on Pi 5, though I haven't tested that quite yet!
Thank you very much.
I'm installing it now on a Pi4 with 8GB of RAM.
I already solved a lot of issues but I'am now stuck on:
TASK [Update resolveconf for local name server use.]
fatal: [127.0.0.1]: FAILED! => {"changed": false, "msg": "Destination /etc/resolvconf.conf does not exist !", "rc": 257}
I can't find the solution now>
Is this something you have seen before?
Best regards,
Timothy
I've got it working by making the resolvconf.conf file.
I also installed this: https://linuxhint.com/update-resolv-conf-on-ubuntu/
I don't know if it helped or broke something.
The Grafana dashboard is working fine only Pi-hole does not work.
It runs but I think I have an IP problem somewhere.
Anyone who succeeded to install under RasPi Bookworm and would like to share instructions for that (for dummies please... ;-) ).
Big thanks in advance!
When trying to install on new SD-card the start fails:
=========================================
TASK [Ensure internet-monitoring environment is running.]
fatal: [127.0.0.1]: FAILED! => {"changed": false, "msg": "Configuration error - kwargs_from_env() got an unexpected keyword argument 'ssl_version'"}
=========================================
This on fully updated "Raspbian GNU/Linux 11 (bullseye)", "Linux 6.1.21-v8+".
Tried with both 32 and 64 bit versions with same result...
Any ideas??
I found the solution here: https://github.com/geerlingguy/internet-pi/issues/567
Open main.yml in a text editor and add the following task to the playbook. It should be placed before any tasks that involve Docker operations:
- name: Install Docker SDK for Python
ansible.builtin.pip:
name:
- "docker==6.1.3"
- "docker-compose"
I'm new to Raspberry Pi 4 and have some limited linux knowledge but not a developer or IT guy. So far running Teslamate, Grafana and Pihole. Installing Internet-pi and get as far as "ansible-playbook main.yml" which fails......
.....Downloaded newer image for prom/prometheus:latest\nlatest: Pulling from grafana/grafana\n", "msg": "Error starting project no matching manifest for linux/arm/v7 in the manifest list entries"}
You need to edit the following file
/internet-pi/templates/docker-compose.yml.j2
Where it says grafana:latest edit the line to specify the version:
image: grafana/grafana:9.2.4
Hi Jeff, I ran across this article a few years ago and got my copy of the speed monitor running successfully. However, after 2+ years, I started having issues with it working properly. It just stopped logging data. However, I can say that I have been updating the software. I'm guessing the updates probably caused some issues. Was wondering if you ran into similar issues?
Took me a while to get this running on my RPi 3 but I finally got it to work!
I thought I'd share my troubleshooting steps:
1. Installing Ansible and Configuring PATH:
- I installed Ansible using pip3.
- I encountered an issue where the installed Ansible scripts were not in my PATH. I resolved this by adding ~/.local/bin to my PATH.
2. Executing the Ansible Playbook and Docker Group Issue:
- Initially, I faced a permissions issue with Docker.
- I resolved this by adding my user to the Docker group and rebooting the system to apply the group change.
3. Fixing Docker SDK for Python Version Compatibility:
- I encountered a compatibility issue with the Docker SDK for Python.
- Based on a discussion in a GitHub issue on the repo, I modified the Ansible playbook to install a specific version of the Docker SDK (docker==6.1.3) before running Docker-related tasks.
4. Resolving Docker Image Compatibility for ARMv7 Architecture:
- I faced a "no matching manifest for linux/arm/v7" error, indicating a compatibility issue with Docker images on my ARMv7 architecture.
- From the project's GitHub issues, I found a solution where updating the Grafana image version to grafana/grafana:9.2.4 resolved the issue.
- I applied this fix by editing the Jinja2 template (docker-compose.yml.j2) in the templates directory of the Internet Pi project to define the Docker Compose configuration.
Hi, I managed to do all command but still have strange problem with this one:
Command: ansible-galaxy install -r requirements.yml
Result:
Starting galaxy collection install process
Process install dependency map
\
And nothing more happens, any clue on this problem, I have waited for more than 30 minutes but nothing happens?
Alright, just decided to give this a try on my RPi4 running DietPi.
I am getting the following error:
TASK [Load configuration (with defaults from example file).] ***************************************************
failed: [127.0.0.1] (item=example.config.yml) => {"ansible_facts": {}, "ansible_included_var_files": [], "ansible_loop_var": "item", "changed": false, "item": "example.config.yml", "message": "Could not find or access 'example.config.yml'\nSearched in:\n\t/root/internet-pi/vars/example.config.yml\n\t/root/internet-pi/example.config.yml\n\t/root/internet-pi/vars/example.config.yml\n\t/root/internet-pi/example.config.yml on the Ansible Controller.\nIf you are using a module and expect the file to exist on the remote, see the remote_src option"}
Any help would be appreciated!
Ok, I nucked it and did a force reinstall, and have that issue resolved, but I have a new issue:
TASK [Ensure internet-monitoring environment is running.] ******************************************************
fatal: [127.0.0.1]: FAILED! => {"changed": false, "msg": "Configuration error - kwargs_from_env() got an unexpected keyword argument 'ssl_version'"}
Any ideas????
Hey Jeff love your content. I was curious, with unlimited internet drying up in most places (data caps bringing a thing), have you had any inkling on adding a component to your project which would allow users to measure data consumed during a specified time period ?
There are a few different means to grab the data SNMP or Netflow to name a few
I know this is technically an "old" project but it is a wonderful asset to both ones who tinkerer and professionals alike.
I just got it running on a new 8gb Raspberry Pi5, took a little work, but it's running good. I've had Pi-Hole running at home for years, but it was time to play around with new lists and try to get my install a little bit more perfect.
Here's the real value add, my real job is an infrastructure engineer, but do some consulting on the side like any decent IT guy does. I do some IT consulting for a few bitcoin mining operations. We have some modified shipping containers holding about 260 miners per container. I throw one of these Internet-Pi devices in each one and we have some good data on internet uptimes and bandwith.
Thanks Jeff!
Does this work on a pi5 with Bookworm? I get allthe way through and it fails at the very end:
TASK [Ensure internet-monitoring environment is running.] **********************
fatal: [127.0.0.1]: FAILED! => {"changed": false, "cmd": "/usr/bin/docker --host unix:///var/run/docker.sock version --format '{{ json . }}'", "msg": "permission denied while trying to connect to the Docker daemon socket at unix:///var/run/docker.sock: Get \"http://%2Fvar%2Frun%2Fdocker.sock/v1.45/version\": dial unix /var/run/docker.sock: connect: permission denied", "rc": 1, "stderr": "permission denied while trying to connect to the Docker daemon socket at unix:///var/run/docker.sock: Get \"http://%2Fvar%2Frun%2Fdocker.sock/v1.45/version\": dial unix /var/run/docker.sock: connect: permission denied\n", "stderr_lines": ["permission denied while trying to connect to the Docker daemon socket at unix:///var/run/docker.sock: Get \"http://%2Fvar%2Frun%2Fdocker.sock/v1.45/version\": dial unix /var/run/docker.sock: connect: permission denied"], "stdout": "{\"Client\":{\"Platform\":{\"Name\":\"Docker Engine - Community\"},\"Version\":\"26.0.0\",\"ApiVersion\":\"1.45\",\"DefaultAPIVersion\":\"1.45\",\"GitCommit\":\"2ae903e\",\"GoVersion\":\"go1.21.8\",\"Os\":\"linux\",\"Arch\":\"arm64\",\"BuildTime\":\"Wed Mar 20 15:18:02 2024\",\"Context\":\"default\"},\"Server\":null}\n", "stdout_lines": ["{\"Client\":{\"Platform\":{\"Name\":\"Docker Engine - Community\"},\"Version\":\"26.0.0\",\"ApiVersion\":\"1.45\",\"DefaultAPIVersion\":\"1.45\",\"GitCommit\":\"2ae903e\",\"GoVersion\":\"go1.21.8\",\"Os\":\"linux\",\"Arch\":\"arm64\",\"BuildTime\":\"Wed Mar 20 15:18:02 2024\",\"Context\":\"default\"},\"Server\":null}"]}
I have the same issue did you manage to fix it? im also on a pi 5
Thanks
sudo chmod 666 /var/run/docker.sock
sudo systemctl restart docker
Lots of info on it online that I found in the end
https://jhooq.com/permission-denied-docker-daemon/
Did anyone manage to make this project run on a pi4, recently, without any/few issues? If so, what OS was used?
I just installed the Internet-Pi software on a Raspi Pi4 using Bookworm. The only issue I have encountered had to do with a StartTime script which is described in issue git issue #598. I got a solution within a couple of hours.
Regards,
Butch
Hi all , I want to ask for some help related to the below error if anybody can chime in and tell me what i need to fix cause i can't make any sense of this error :
Running a Pi5 4gb and ubuntu 23.10
"fatal: [127.0.0.1]: FAILED! => {"cache_update_time": 1713720081, "cache_updated": false, "changed": false, "msg": "'/usr/bin/apt-get -y -o \"Dpkg::Options::=--force-confdef\" -o \"Dpkg::Options::=--force-confold\" install 'libffi-dev=3.4.4-1' 'libssl-dev=3.0.10-1ubuntu2'' failed: E: Unable to correct problems, you have held broken packages.\n", "rc": 100, "stderr": "E: Unable to correct problems, you have held broken packages.\n", "stderr_lines": ["E: Unable to correct problems, you have held broken packages."], "stdout": "Reading package lists...\nBuilding dependency tree...\nReading state information...\nSome packages could not be installed. This may mean that you have\nrequested an impossible situation or if you are using the unstable\ndistribution that some required packages have not yet been created\nor been moved out of Incoming.\nThe following information may help to resolve the situation:\n\nThe following packages have unmet dependencies:\n libssl-dev : Depends: libssl3 (= 3.0.10-1ubuntu2) but 3.0.10-1ubuntu2.1 is to be installed\n", "stdout_lines": ["Reading package lists...", "Building dependency tree...", "Reading state information...", "Some packages could not be installed. This may mean that you have", "requested an impossible situation or if you are using the unstable", "distribution that some required packages have not yet been created", "or been moved out of Incoming.", "The following information may help to resolve the situation:", "", "The following packages have unmet dependencies:", " libssl-dev : Depends: libssl3 (= 3.0.10-1ubuntu2) but 3.0.10-1ubuntu2.1 is to be installed"]}"
I'm seeing something similar and I've tried installing some of these dependencies but they failed to install other generic errors.
Dashboard uses Angular that is deprecated and will stop working at some point?
Is this going to be updated as it is a great tool?
Thanks jeff for this project, very helpful and powerfull tool! this helps a lot of getting insights
Hello Maybe i can find some answers here i and having an issue with the docker.composer.yml versioning and got this error. "[WARNING]: /root/internet-monitoring/docker-compose.yml: `version` is obsolete"