I recently wrote about using a Raspberry Pi to remotely monitor an Internet connection, and in my case, to monitor Starlink (SpaceX's satellite Internet service).
One other important thing I wanted to monitor was how much power Starlink used over time, and I was considering just manually taking a reading off my Kill-A-Watt every morning, but that's boring. And not very accurate since it's one point in time per day.

Digging around, I found out about the Shelly Plug US, which had its own little built-in HTTP API and a supposedly-accurate power monitor. It's based on the ESP8266, and you can even flash alternative firmware like Tasmota for more control over the device.
Getting Shelly Plug US
At the time of writing, the Shelly Plug US seemed to be stuck in pre-order status, but there were some available on eBay, so I bought one from someone who seemed reputable there.
When it arrived, it was in a very tidy little box hardly larger than the plug itself, and I am happy to report it's not a fake or knockoff (I'm always a little nervous buying IoT devices from eBay. Though Amazon has also been vying for the 'who should I trust the least' slot lately).
Setting up the Shelly Plug
I didn't want to create a Shelly Cloud account, use the Shelly App, and all that jazz. I'd rather not have some of my home's electrical infrastructure controllable over the Internet by default.
So instead, I did the following:
- Plug in the Shelly Plug, and plug a load into it (in this case, my Starlink power brick, which powers the Starlink dish and router).
- Press the power button on it to turn it on.
- On my Mac, connect to the
shellyplug___network (the Plug is in AP mode by default). - Wait for a DHCP address on my Mac, then connect to the
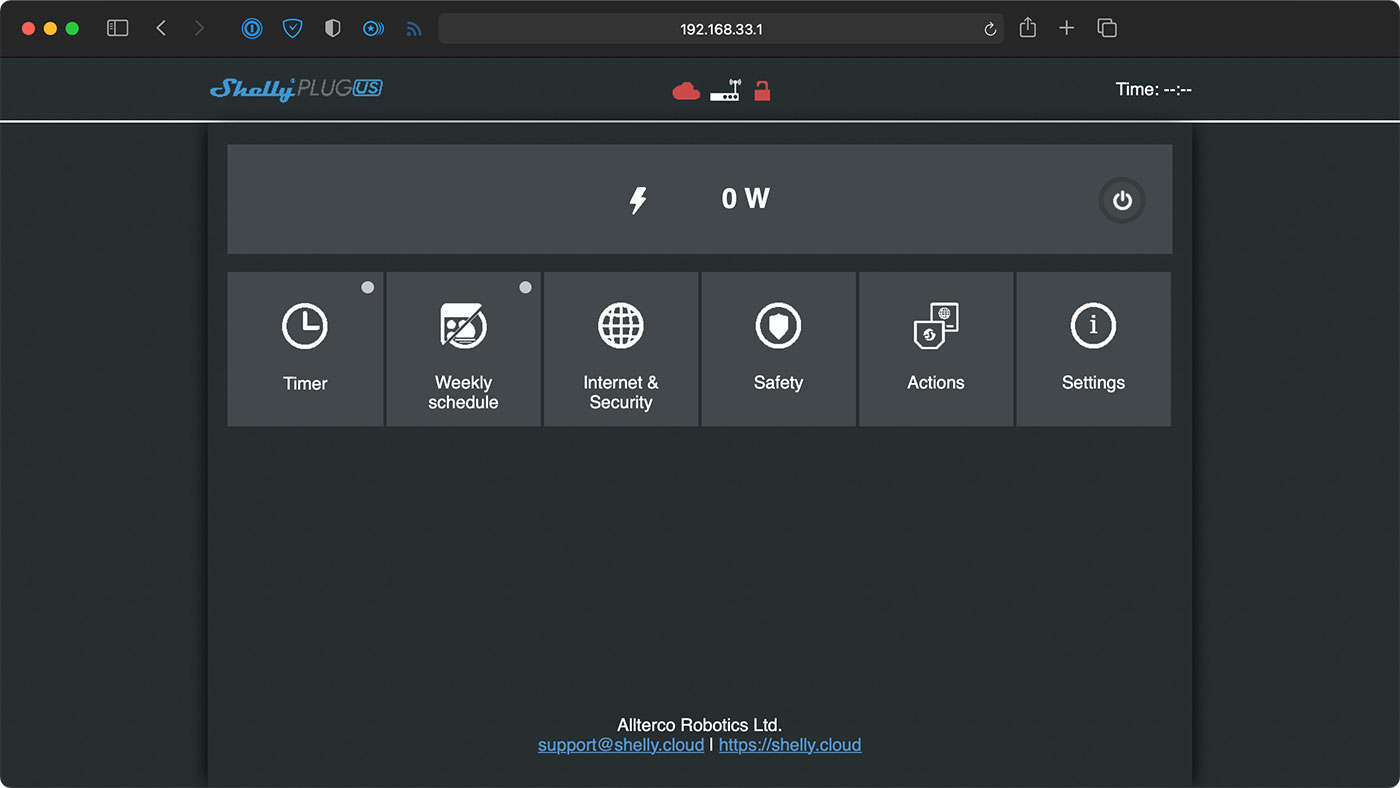
.1of that CIDR (in my case, I connected to192.168.33.1in my browser).
At this point, I got to the Shelly Plug web UI:
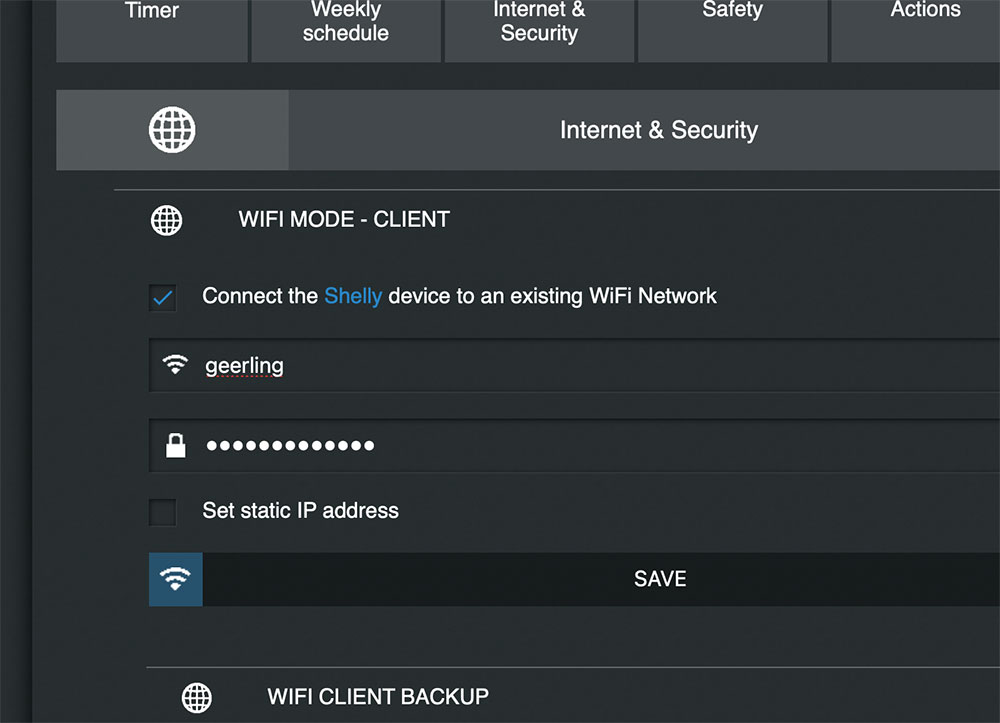
I went to the 'Internet & Security' pane, and set the Plug to connect to my existing WiFi network (note: the Plug only operates on 2.4 GHz, so don't try connecting to a 5 GHz-only network!):
Then I used fing (you could also use nmap) to find the new Shelly plug once it had connected to my WiFi network. If you set a static IP you could skip this step.
I connected back to it again, then updated my DHCP and DNS servers to add a static IP address and DNS mapping for the plug, so it would be easy to connect to it inside my house at shelly1.geerli.net.
Note: I also updated the device's firmware at this point, and set a Web UI access password. It's better than nothing, but in general, if you don't trust the company that makes the device (and even if you do...), don't buy it, or segregate it on a separate WiFi network.
Getting power consumption
I dug into the Shelly Plug API to see how I could get the one valuable bit of information I wanted out of it: the current power consumption.
And it looks like I can get that data through the endpoint /meter/0, so I confirmed as much with curl:
$ curl http://admin:[email protected]/meter/0
{"power":85.05,"overpower":0.00,"is_valid":true,"timestamp":1618501251,"counters":[90.138, 26.141, 0.000],"total":116}
The power is returned in Watts, and the total is "Total energy consumed by the attached electrical appliance in Watt-minute", which I'm guessing is reset every now and then. No problem, we'll be using the spot value from power, and we can aggregate the data to get things like daily/weekly/monthly totals later.
Monitoring the data with Prometheus and Grafana
All right, so I have a way to get the data from the Shelly plug, but I want to add a graph of this data over time, to see if there are any trends (e.g. does Dishy consume more energy at night, or on a cloudy or stormy day?), and to have a 100% accurate calculation of the kilowatt-hours of energy it consumes (which can be converted into a cost estimation for other people interested in Starlink).
I initially dug into the Prometheus documentation for how to generate metrics using their official client libraries (see Writing exporters), but it seemed like that documentation—and most everything else on the internet like it—was laser-focused on "getting app metric data out of your [Go|Python|Ruby|etc.] app", and not on the use case of "write a really simple scraper that drops a couple values into Prometheus."
# HELP my_metric A metric I'm interested in monitoring, like power in Watts.
# TYPE my_metric gauge
my_metric 79
So I just looked at the expected metrics endpoint output format (above), pulled out my golden hammer (PHP), and wrote a 52-line PHP script (see my shelly-plug-prometheus project) that:
- Grabs some environment vars for connection configuration.
- Requests the metrics endpoint for the Shelly Plug.
- Parses out relevant metrics.
- Returns that data at the /metrics endpoint.
And being a super-lazy developer (lazy could also be called 'efficient'), I didn't want to spend the extra 5 minutes building a Docker image and maintaining that, so I built the PHP script so I could just run it inside an instance of the official PHP Docker image like so:
docker run -d -p 9924:80 --name shelly-plug \
  -e SHELLY_HOSTNAME='my-shelly-plug-host-or-ip' \
  -e SHELLY_HTTP_USERNAME='username' \
  -e SHELLY_HTTP_PASSWORD='password' \
  -v "$PWD":/var/www/html \
  php:8-apache
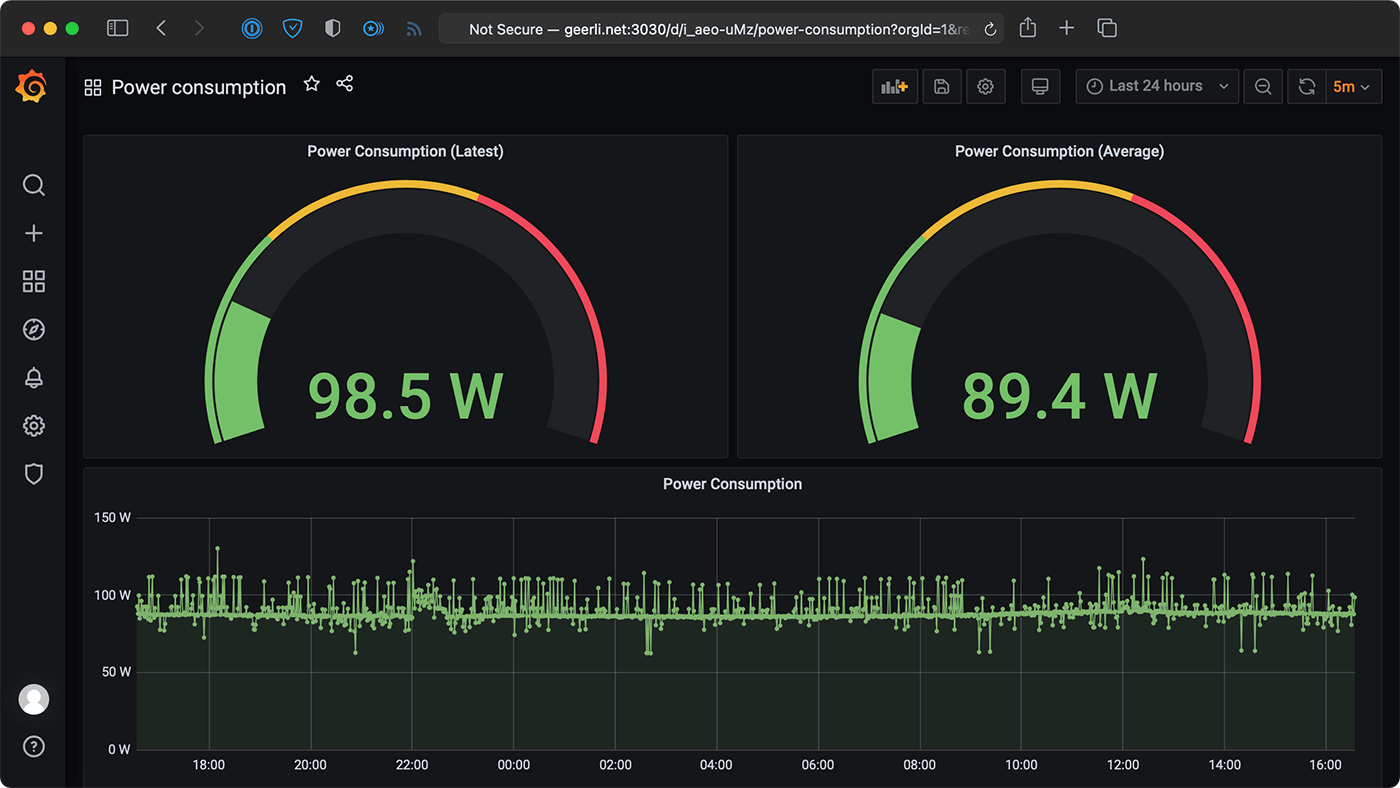
I added configuration to start the Shelly Plug monitoring container to my internet-pi repository, deployed it to the Raspberry Pi that dutifully reminds me how often my main ISP (Spectrum) does not give me near the performance I pay for, and then built a dashboard that shows me power usage:
That dashboard is in code here: https://github.com/geerlingguy/internet-monitoring/blob/master/grafana/provisioning/dashboards/power-consumption.json.
The one thing missing is a display of kWh for the selected time period (or just a graph of kWh per day or something like that). My Grafana-foo is not yet good enough to figure out how to put the math involved in translating point-in-time Watt readings (or one average) into a kWh display using Prometheus data (it seems like the people who do power monitoring with Grafana mostly use InfluxDB and the query syntax there is more familiar to me).
Yes, I know I could use Home Assistant to do all this, but I don't right now and I'm still waiting for more maturation in the whole "Connected Home" space before I trust putting even more things in my living space into some central API!
And yes, I know I could also configure MQTT to do some of this stuff, but I don't currently use MQTT so it's as much work (for now) to create a separate exporter and manage the data myself.
Conclusion
Since I found the Shelly Plug, I'm happy enough with it. It saved me from trying to build some sort of Pi or Pico-connected power measurement device, though I'm surprised more manufacturers don't have power-monitoring smart plugs.
I mean, P3 International, makers of the Kill-A-Watt, would be a shoe in for 'easily incorporate the already-measured data into a dashboard', I would think.
As it is, there are only a few smart plugs that do power monitoring on the device / appliance-level. Otherwise you have to build a whole home monitoring solution in your electrical box, and you can only really get the data there on a circuit-level.
I'll be reviewing SpaceX's Starlink more in-depth soon, but for now, it seems to use about 90W continuously, on average, all day every day, with very few spikes above 100W, and seemingly no power consumption correlation to transmit/receive activity or weather.
Comments
Til starlink is really power hungry.
Wow, that's a crazy amount of power! Especially for a "green" company like Tesla. With that power, I can run my DSL modem 24/7 AND drive my electric car 6000 km every year.
What on Earth (wink) is it doing with 90W? Is there a heater in there?
I think for the first version of the dish, power optimization wasn't really a goal. It takes a lot of power to operate the phased array antenna to track satellites constantly, while transmitting and receiving, alongside all the other supporting bits inside the dish. In some ways, I'd call the thing more a full-fledged outdoor computer that happens to be in a shape resembling a dish, rather than a dish like you'd get for DirecTV.
What a pollution!
This doesn't bode well for using Starlink at my offgrid cabin. My little 3000W solar system already gets pushed to the limit. I guess I could fire up the generator whenever I need the internet but that's a bit of a pita.
Going to try to mod this by subbing the Shelly for the more available BN-LINK WiFi Heavy Duty Smart Plug Outlet available on Amazon. Will report back if successful.
Russ — I, and probably others, would like to hear about your efforts even if you are not successful. Knowing what doesn’t work / what was attempted is almost as valuable as hearing about what is successful :-)
And the verdict is? :-)
I did something similar with zwave a while back. I have some power strips, dimmers, applicate controllers, & a mains monitor, and they all have power monitoring capabilities. I wrote a small node.js script to make a Prometheus exporter that would log the device's stats including instance power usage & total kWh. https://github.com/rektide/prom-ozz-zwave
I couldn't connect to the Shelly AP network with Windows or Apple devices. I thought my plug was defective, until I found this post: https://www.shelly-support.eu/forum/index.php?thread/7509-unable-to-con…
Configuring a Pi to connect to the network worked like a charm.
How would you get this playbook working with more than one Shelly plug? Would you just need to add another port in the docker-compose file?
Sort-of. There are a couple modifications you'd need to make to get multiple Shelly Plugs working—check out this issue for details.
Just wondering, have you had any issues over time of the plugs becoming unresponsive and having to unplug/plug back in to "reboot" them? Looking for replacement "smart" plugs that are able to be controlled via mqtt or rest api (locally) (or even power strips) .. the power monitoring would definitely be bonus for monitoring like you describe, but also be able to detect if something is left on (for example).. Not being familiar with Prometheus was assuming that you were using Influxdb (time series db) behind your Grafana.
They have a power saving eco mode which defaults to on in the settings, try turning that off.
I wrote a script in Python for exposing the power consumption of my shelly plug s, the metrics are exposed on port 8000
#!/usr/bin/python
# -*- coding:utf-8 -*-
import ctypes
import logging
import time
#import smbus
import requests
import re
from prometheus_client import Gauge, start_http_server
#from systemd.journal import JournalHandler
#from systemd import journal
from systemd.journal import JournaldLogHandler
#SCRIPT_PATH=$(dirname "$(realpath "$0")")
# Setup logging to the Systemd Journal
log = logging.getLogger('Shelly_Plug_Power')
#log.addHandler(journal.JournaldLogHandler())
log.addHandler(JournaldLogHandler())
log.setLevel(logging.INFO)
# The time in seconds between sensor reads
READ_INTERVAL = 60.0
# Create Prometheus gauges for humidity and temperature in
# Celsius and Fahrenheit
gt = Gauge('power',
'power', ['scale'])
# Initialize the labels for the temperature scale
gt.labels('Watt')
def read_shelly():
try:
#HTTP Anfrage an Shelly und Weitergabe an Prometheus
response=requests.get("http://IP OF YOUR SHELLY/meter/0")
powertxt=re.search('"power":(.*),"overpower"',response.text)
# print(response.text)
# print(powertxt.group(1))
power=float(powertxt.group(1))
print(type(power))
except RuntimeError as e:
# GPIO access may require sudo permissions
# Other RuntimeError exceptions may occur, but
# are common. Just try again.
log.error("RuntimeError: {}".format(e))
if power is not None:
gt.labels('Watt').set(power)
log.info("Power:{0:0.1f}*W".format(power))
# time.sleep(READ_INTERVAL)
if __name__ == "__main__":
# Expose metrics
metrics_port = 8000
start_http_server(metrics_port)
print("Serving sensor metrics on :{}".format(metrics_port))
log.info("Serving sensor metrics on :{}".format(metrics_port))
while True:
read_shelly()
time.sleep(60)
I think the kWh should be easy to do with a sum_over_time() Prometheus expression ?
e.g. if you scrape every minute, you can do sum_over_time(metric[1h]) * 60
Does anyone know if there have been changes with Shelly Plug US's firmware? I just got myself one but am unable to pull any info from it even using the curl test. Plug is up and running fine, IP is set, no issues connecting over the network. It appears to work properly and I have no problem accessing the built in webserver. Seems to just not have data available at the location your scripts look at.
The recommended curl test:
curl http://192.168.1.206/meter/0
Not Found
can't bring up http://192.168.1.206/meter/0 in a browser (get that same 'Not Found'), and if I just hit the IP without directory info I get a page at http://192.168.1.206/#/
So I tried: http://192.168.1.206/#/meter/0
and that leaves me inside the webserver interface but with a "404 There is no such page!" error on it.
Digging around Shelly API docs I found this does work although obviously does not return just the one data point I am interested in because it gives you everything (interestingly without needed credentials at all):
curl -X POST -d '{"id":1,"method":"Shelly.GetStatus"}' http://192.168.1.206/rpc
Any ideas? I've been running the whole internet monitoring along side my existing PiHole for a few months now without issue and I'd like to add power monitoring. I'll keep digging for now and make changes myself if I can come up with a way to resolve the issue.
I did update the Shelly to latest firmware as you recommended but firmware may have changed since then? Not sure if Shelly will update anyone's firmware with something that different just out of the blue. Mine is showing v1.4.2-gc2639da.
I looked briefly at Tasmota but it was not clear to me what I need to use that, seems a bit confusing and I didn't want to risk bricking this thing just yet.
Any help would be appreciated, I know it's an old topic but I'm lost as to why it doesn't all just work.
One last try maybe I wont submit by accident. Have a Gen2 but not sure where I set the SHELLY_GENERATION=2. Can I just set the environment variable before running the ansible-playbook again?? Tried putting that in the config file and of course it did not like that. Am I along the correct path here? Waiting patiently for my grafana to populate .....
Last message (really):
I set my env variable correctly, relogged-in and still getting same results:
cadstar@thinkpad:~/internet-pi$ echo $SHELLY_GENERATION
2
cadstar@thinkpad:~/internet-pi$ curl http://localhost:9924/metrics
# HELP power Current real AC power being drawn, in Watts
# TYPE power gauge
power
Warning: Attempt to read property "power" on null in /var/www/html/shellygen1 on line 42
# HELP is_valid Whether power metering self-checks OK
# TYPE is_valid gauge
is_valid
Warning: Attempt to read property "is_valid" on null in /var/www/html/shellygen1 on line 46
# HELP total Total energy consumed by the attached electrical appliance in Watt-minute
# TYPE total gauge
total
Warning: Attempt to read property "total" on null in /var/www/html/shellygen1 on line 50
OK Jeff, I finally got it working.
After much trial and error and pulling my hair out cause I know BASH well but I don't know PHP at all, I finally found that if I edited:
~/internet-pi/templates/shelly-plug-docker-compose.yml.j2
adding the new line under environment:
SHELLY_GENERATION: '{{ shelly_plug_generation }}'
After that I could then add a new option to the ~/internet-pi/config.yml:
shelly_plug_generation: 2
and now monitoring is working after playbook rerun! Question is did I miss where you explained this?? All I had to go on was that I needed to set a variable, but then why would adding it to config.yml not be enough? Again I don't know PHP, did I at least arrive at the "correct" solution??
One last thought: wanted to add that from what I have been able to determine, all Shelly Plugs sold in the US since 2022 are like mine: the new Gen2 devices labeled only "Shelly Plug US" even though they are confusingly "Shelly Plus Plug US" in reality. So pretty much everyone that works with the internet-monitoring project these days will be getting newer devices. I am 100% not trying to justify how long it took me to figure out how to make a Gen2 shelly plug work. (was less than a day at least)