monitoring

Monitoring my ASUS RT-AX86U Router with Prometheus and Grafana

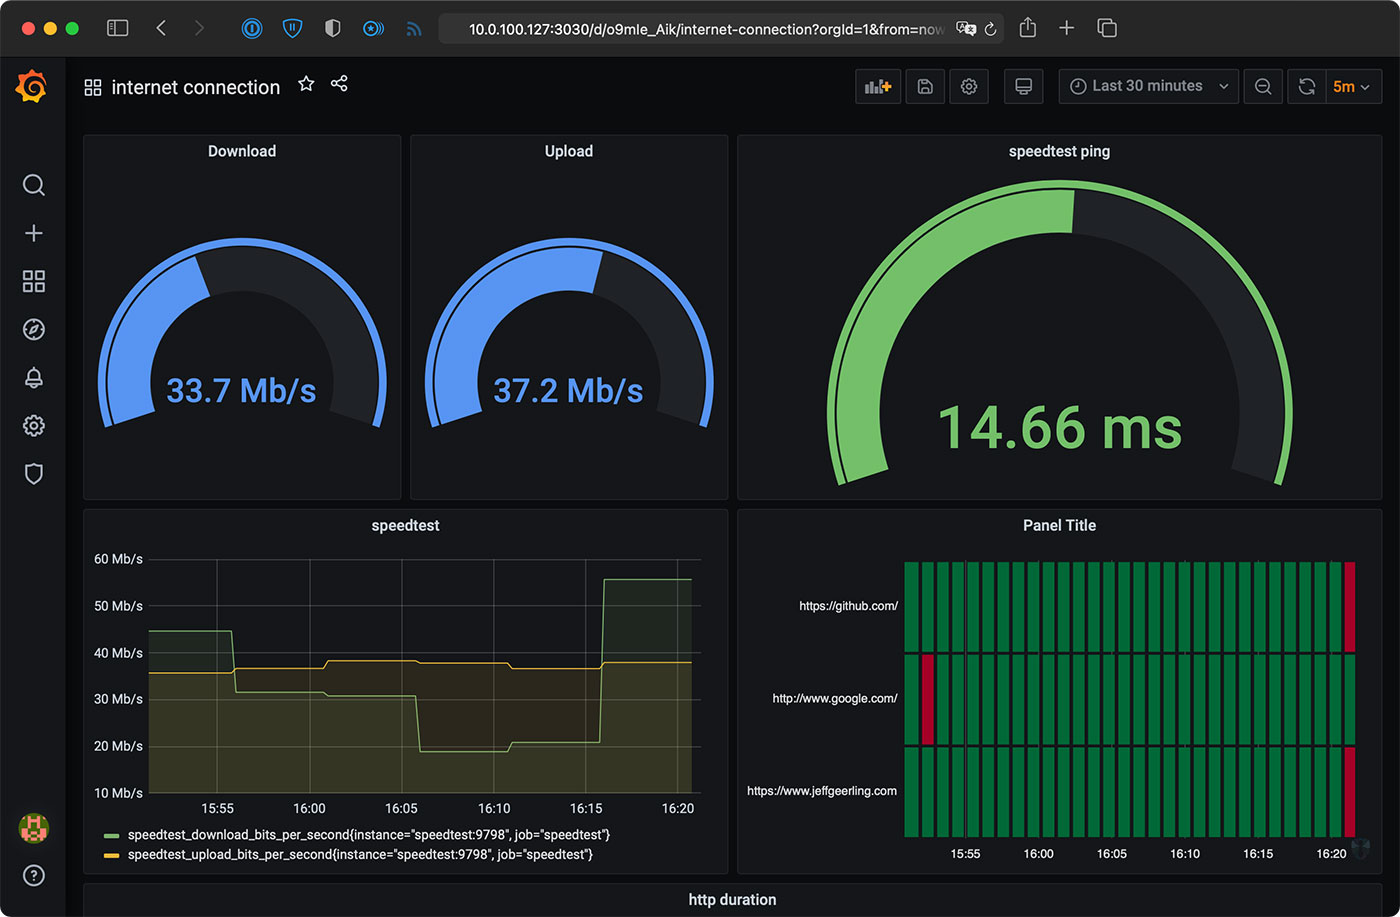
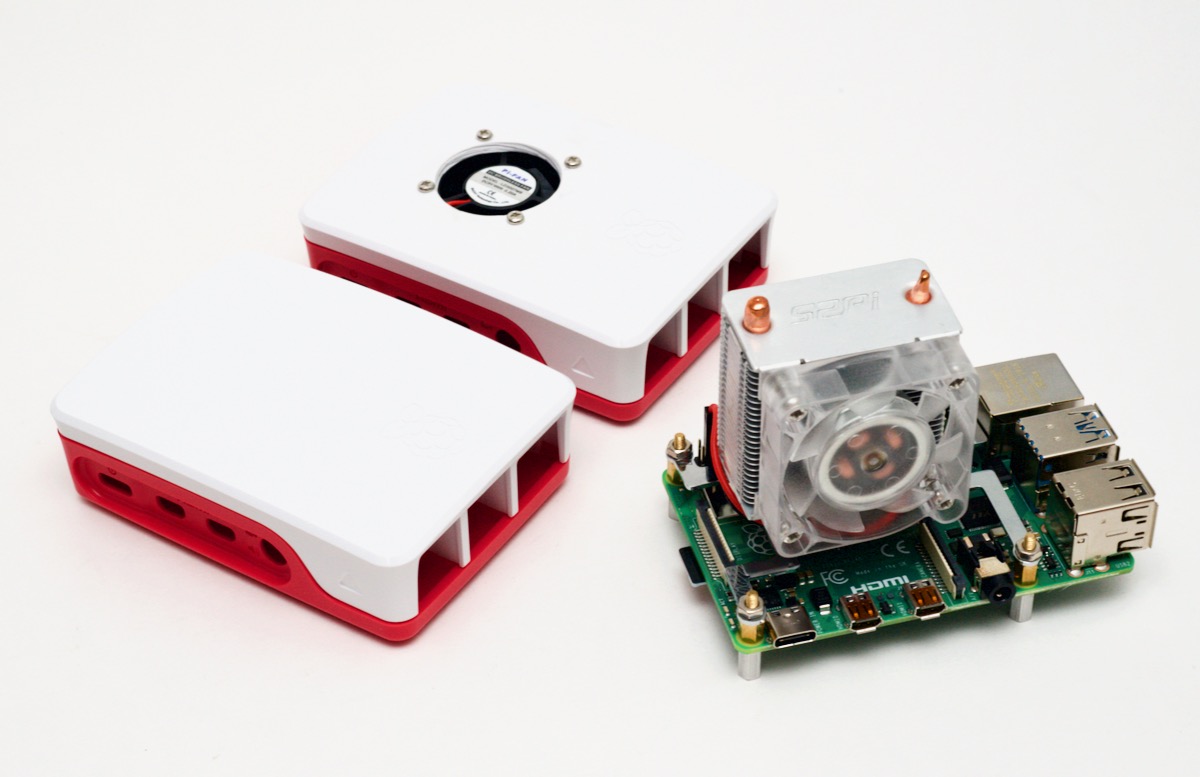
I've been running my Internet Monitoring Pi for a year or so, and it's nice to collect data on Internet performance from inside my network.

But my router—currently an ASUS RT-AX86U—also tracks its own metrics for inbound and outbound traffic, among other things:

ASUSWRT-Merlin System Status Dashboard metrics

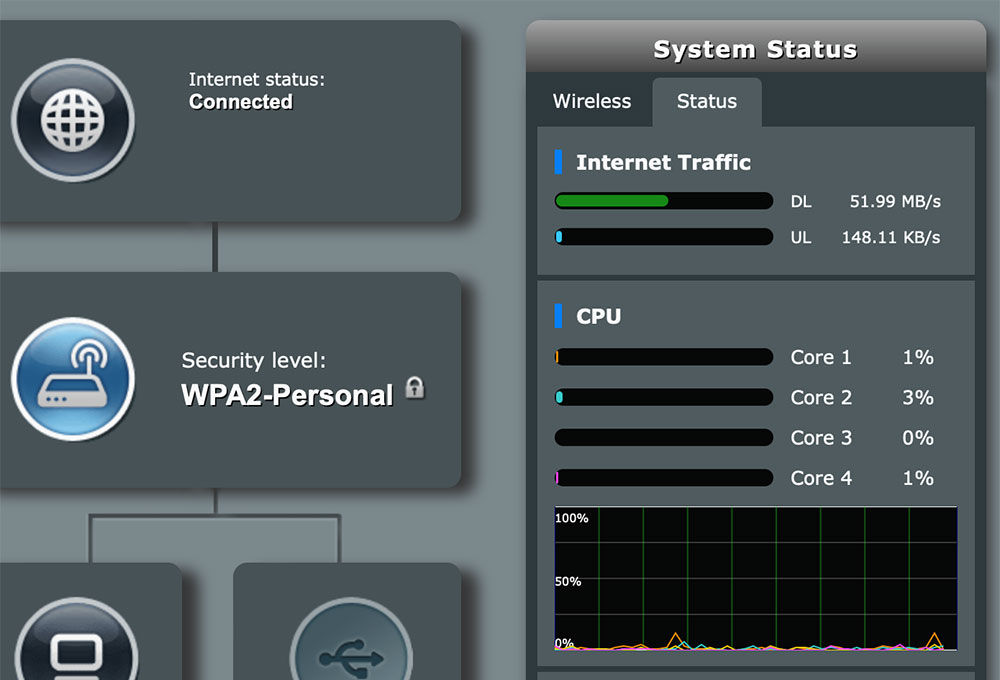
Sometimes having the raw data from the router that's on the edge of the network can tell a different story than measuring things behind the router. So I want to grab this data and put it into Prometheus.

Three DDoS attacks on my personal website

Update: After posting the video yesterday, the site was hit by more low-complexity DDoS attacks, mostly just spamming one URL at a time. After I cleaned those up, the attacker finally switched to a more intelligent offense, posting actual comments to the site overnight. This morning I noticed that, and the fact the attacker found I left my edit domain un-proxied, so I switched to a different IP on DigitalOcean and shored up the Cloudflare configuration a bit more.

It was a good thing I did that, because about the same time, I got an email from DigitalOcean support saying they had to blackhole the other IP for getting 2,279,743 packets/sec of inbound traffic. Sheesh.

After cleaning up a few bits of fallout, the site should be running a bit better at this point, DDoS or no.

Monitor your Internet with a Raspberry Pi

Internet Service Providers are almost universally despised. They've pushed for the FCC to continue defining 25 Mbps as "high use" broadband, and on top of that they overstate the quality of service they provide. A recently-released map of broadband availability in the US paints a pretty dire picture:

USA map showing areas with limited high speed broadband availability

Here in St. Louis—where I guess I should count my lucky stars we have 'high use' broadband available—I have only two options: I can get 'gigabit' cable Internet from Spectrum, or 75 megabit DSL from AT&T.

That's it.

And you're probably thinking, "Gigabit Internet is great, stop complaining!"

Using the Shelly Plug to monitor Starlink's power consumption

I recently wrote about using a Raspberry Pi to remotely monitor an Internet connection, and in my case, to monitor Starlink (SpaceX's satellite Internet service).

Power Consumption Grafana dashboard with Shelly Plug US power usage coming through

One other important thing I wanted to monitor was how much power Starlink used over time, and I was considering just manually taking a reading off my Kill-A-Watt every morning, but that's boring. And not very accurate since it's one point in time per day.

Shelly Plug US

Setting up a Pi for remote Internet connection monitoring

So... recently I acquired a Starlink 'Dishy', and I'm going to be installing it at a rural location near where I live, but since it's a bit of a drive to get to it, I wanted to set up a Raspberry Pi to monitor the Starlink connection quality over time.

Internet monitoring dashboard in Grafana

I know the Starlink app has its own monitoring, but I like to have my own fancy independent monitoring in place too.

The wrinkle with a Starlink-based Internet connection, though, is that SpaceX is using Carrier-Grade NAT (CGNAT) on their network, so there won't be any kind of IPv4 address I could reach the Pi at, nor does SpaceX yet have IPv6 set up in their network.

So to make remote access possible, I would have to find a way to have the Pi reach out to one of my servers with a persistent connection, then I could 'tunnel' through that server from other locations to reach the Pi.

The Raspberry Pi 4 might not need a fan anymore

tl;dr: After the fall 2019 firmware/bootloader update, the Raspberry Pi 4 can run without throttling inside a case—but only just barely. On the other extreme, the ICE Tower by 52Pi lives up to its name.

Raspberry Pi 4 cooling options including ICE tower cooling fan and a case mod fan
Three options for keeping the Pi 4 cozy: unmodified Pi 4 case, modded case with fan, and the ICE Tower.

A few months ago, I was excited to work on upgrading some of my Raspberry Pi projects to the Raspberry Pi 4; but I found that for the first time, it was necessary to use a fan to actively cool the Pi if used in a case.

Two recent developments prompted me to re-test the Raspberry Pi 4's thermal properties:

Limiting disk iops on a larger Munin server using rrdcached

I've long used Munin for basic resource monitoring on a huge variety of servers. It's simple, reliable, easy to configure, and besides the fact that it uses Perl for plugins, there's not much against it!

Last week, I got a notice from my 'low end box' VPS provider that my Munin server—which is aggregating data from about 50 other servers—had high IOPS and would be shut down if I didn't get it back into an allowed threshold. Most low end VPSes run things like static HTML websites, so disk IO is very low on average. I checked my Munin instance, and sure enough, it was constantly churning through around 50 iops. For a low end server, this can cause high iowait for other tenants of the same server, so I can understand why hosting providers don't want applications on their shared servers doing a lot of constant disk I/O.

Using iotop, I could see the munin-update processes were spending a lot of time writing to disk. And munin's own diskstats_iops plugin showed the same:

Monitoring Kubernetes cluster utilization and capacity (the poor man's way)

If you're running Kubernetes clusters at scale, it pays to have good monitoring in place. Typical tools I use in production like Prometheus and Alertmanager are extremely useful in monitoring critical metrics, like "is my cluster almost out of CPU or Memory?"

But I also have a number of smaller clusters—some of them like my Raspberry Pi Dramble have very little in the way of resources available for hosting monitoring internally. But I still want to be able to say, at any given moment, "how much CPU or RAM is available inside the cluster? Can I fit more Pods in the cluster?"

So without further ado, I'm now using the following script, which is slightly adapted from a script found in the Kubernetes issue Need simple kubectl command to see cluster resource usage:

Usage is pretty easy, just make sure you have your kubeconfig configured so kubectl commands are working on the cluster, then run:

Getting Munin-node to monitor Nginx and Apache, the easy way

Since this is something I think I've bumped into at least eight times in the past decade, I thought I'd document, comprehensively, how I get Munin to monitor Apache and/or Nginx using the apache_* and nginx_* Munin plugins that come with Munin itself.

Besides the obvious action of symlinking the plugins into Munin's plugins folder, you should—to avoid any surprises—forcibly configure the env.url for all Apache and Nginx servers. As an example, in your munin-node configuration (on RedHat/CentOS, in /etc/munin/plugin-conf.d, add a file named something like apache or nginx):

# For Nginx:
[nginx*]
env.url http://localhost/nginx_status

# For Apache:
[apache*]
env.url http://localhost/server-status?auto

Now, something that often trips me up—especially since I maintain a variety of servers and containers, with some running ancient forms of CentOS, while others are running more recent builds of Debian, Fedora, or Ubuntu—is that localhost doesn't always mean what you'd think it means.

Fixing Munin's [FATAL ERROR] Lock already exists: /var/run/munin/munin-update.lock. Dying.

Recently, I upgraded one of my CentOS and Ubuntu servers to a new version of Munin 2.0.x, and started getting an error stating that munin-update.lock already exists:

2013/03/25 23:11:02 Setting log level to DEBUG
2013/03/25 23:11:02 [DEBUG] Lock /var/run/munin/munin-update.lock already exists, checking process
2013/03/25 23:11:02 [DEBUG] Lock contained pid '10160'
2013/03/25 23:11:02 [DEBUG] kill -0 10160 worked - it is still alive. Locking failed.
2013/03/25 23:11:02 [FATAL ERROR] Lock already exists: /var/run/munin/munin-update.lock. Dying.
2013/03/25 23:11:02  at /usr/lib/perl5/vendor_perl/5.8.8/Munin/Master/Update.pm line 128

Munin hadn't been updating for a couple weeks, so I finally deleted the existing munin-update.lock file, and munin started running again. If this doesn't help solve your problem, have a look inside the various munin log files in /var/log/munin/ to see if one of them contains more details as to why munin isn't working for you.