Internet Service Providers are almost universally despised. They've pushed for the FCC to continue defining 25 Mbps as "high use" broadband, and on top of that they overstate the quality of service they provide. A recently-released map of broadband availability in the US paints a pretty dire picture:

Here in St. Louis—where I guess I should count my lucky stars we have 'high use' broadband available—I have only two options: I can get 'gigabit' cable Internet from Spectrum, or 75 megabit DSL from AT&T.
That's it.
And you're probably thinking, "Gigabit Internet is great, stop complaining!"
But Spectrum's "gigabit" Internet is 930 megabits down—in ideal conditions—but only 40 megabits up. And that's the highest plan that costs about $150 a month!
Some would die for those speeds (see the map above), but much of the world is better off. And are you really getting the speeds you pay for? You probably don't know.
Well, I do, thanks to a $35 Raspberry Pi! And you don't even need a Pi, you could run the software I use on any computer. I just like having a dedicated computer to run all my Internet connection tools, so it's easy to backup or replace, and it doesn't get bogged down.
Video
I have a video that goes along with this blog post, and it's embedded below; skip past it if you prefer reading over viewing.
My Internet Pi
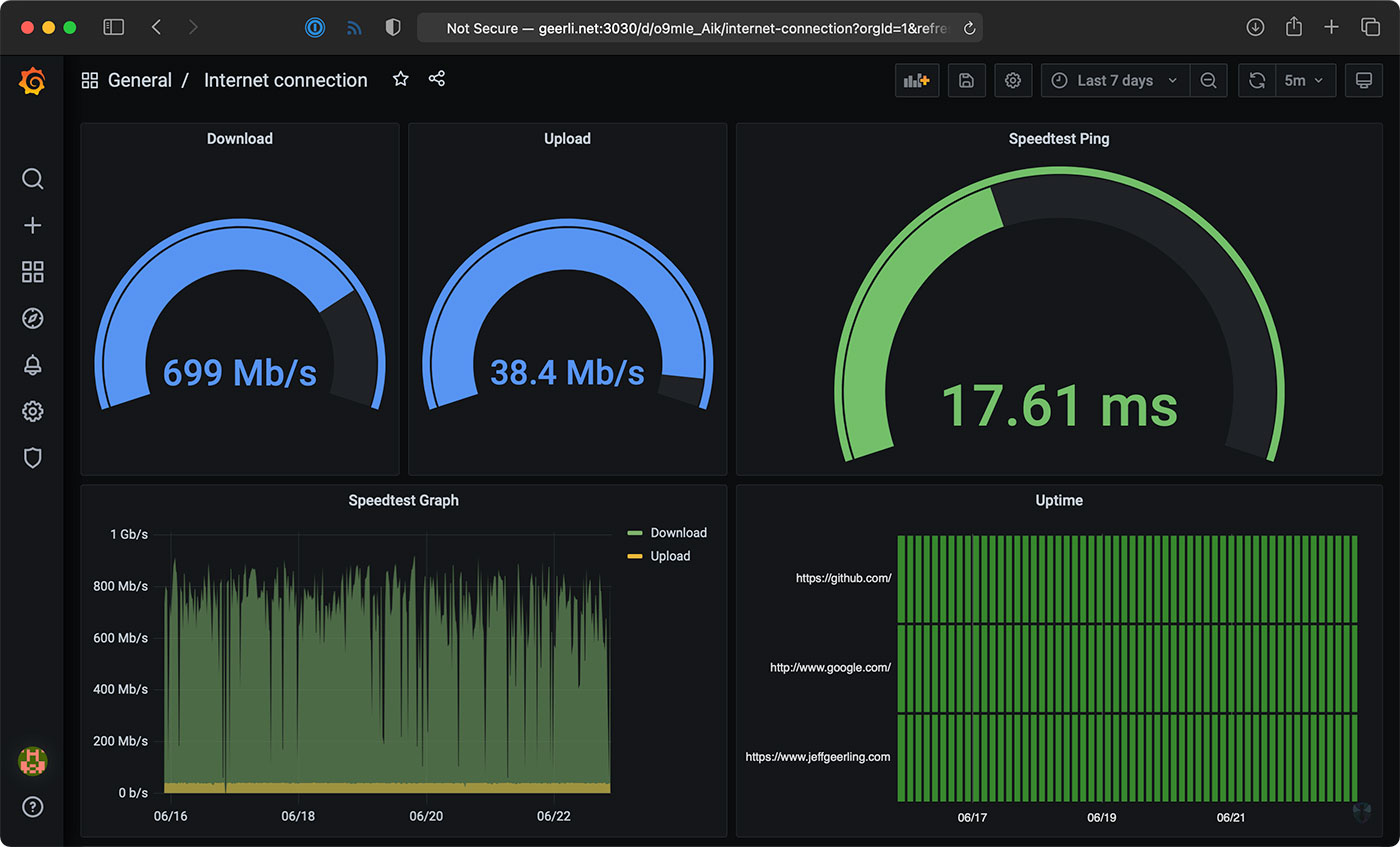
This is my "Internet Pi" (hostname geerli.net):

I have it installed in a rack (here's a video on the Pi rack), but it could just as easily be on my desk, or sitting by my Internet router.
The most important thing for measuring a network connection is that it's wired. WiFi, especially on the Pi, fluctuates quite a bit and is terrible for monitoring anything besides maybe WiFi signal strength.
The Internet Pi runs Pi-hole for DNS privacy and ad-blocking, and Prometheus and Grafana to provide Internet connection monitoring dashboards.
Having a Pi monitoring my Internet continuously makes it easy to see trends over time, or confirm outages. If you just spot check by running a Speedtest every now and then, you don't have much data to go on.
Setting up Internet Pi
I built the free and open source internet-pi project on GitHub. It's simple to set up, and you can choose which parts of the platform you want to use.
I set up my Internet Pi from another computer, but you could also run the Internet Pi playbook on the Pi itself. Following the install instructions, you need to have a Pi set up with Raspberry Pi OS running on your network, and be able to SSH into the Pi.
Here are the steps to get it going:
- Make sure you have Ansible installed:
- (If
pip3is not installed)sudo apt-get install -y python3-pip pip3 install ansible
- (If
- Download the internet-pi repository to your computer:
git clone https://github.com/geerlingguy/internet-pi.git && cd internet-pi - Install the Ansible Galaxy content that's required to make the playbook work:
ansible-galaxy install -r requirements.yml - Make copies of the
example.inventory.iniandexample.config.ymlfiles (dropping theexample.from the filenames) and modify them for your own needs - Run the playbook:
ansible-playbook main.yml
The playbook installs all the tools you choose in your configuration file, and once that's done, you should be able to access your Pi's IP address in a web browser to see Pi-hole, or visit the IP address with the port :3030 on the end to see the Grafana dashboards.
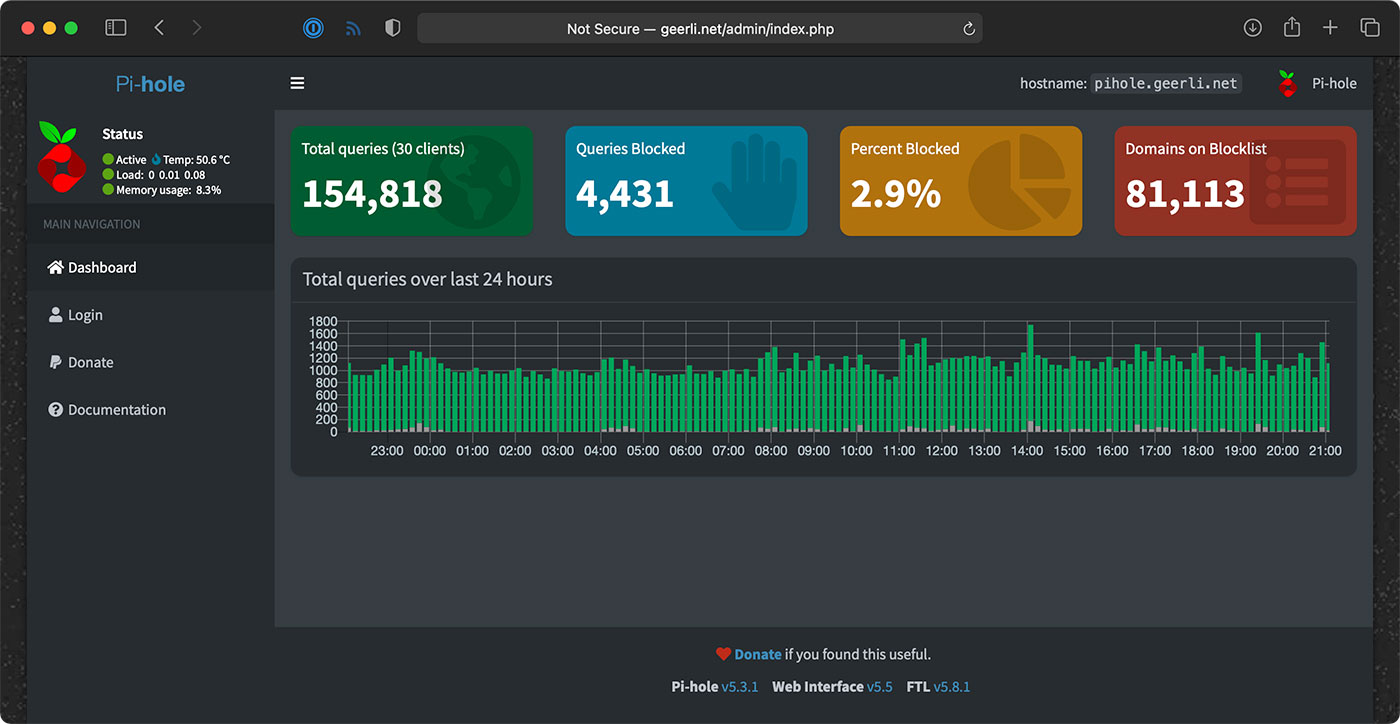
Setting up Pi-hole
If you wanna use Pi-hole as your home network's DNS server, you should configure your router to advertise the Pi's IP address as the primary DNS server for your whole home network. For extra redundancy, you could actually configure two Pis running Pi-hole, but that's a topic for another post!
But the great thing is, that allows you to see all the DNS requests your devices are making, and make sure (for the most part) things like so-called 'smart' TVs don't send tons of information to advertisers.
Pi-hole is a great first line of defense for your Internet privacy, at least at home, and it even has some other neat tools like a simple DNS server, if you want to use them.
Internet monitoring
The Internet monitoring dashboard is automatically configured for you, but it can take up to an hour before you start seeing data.
In my case, it's been running for a couple months, so I can see the Internet connection for the past day, week, or even longer!
The monitoring configuration runs one container that connects to Speedtest.net. Every 30 minutes or so, another container running Prometheus tells the first container to run a speed test.
NOTE: If you run this monitoring on your own network, be aware that these Speedtest.net checks will consume a good amount of data, especially if you run them more frequently. If you have data caps and want to use this monitoring solution, make sure to modify the check interval so you don't get an unexpected overage. ISPs, gotta love 'em!
It stores that data on the Pi, and the Grafana dashboard displays it over time. There's another service that does simple checks on websites you can configure for uptime and HTTP request timing stats—those lightweight checks are performed every few seconds, to give a detailed view when there is more latency in your Internet connection.
One thing I found interesting was my Cable internet connection—which is supposed to be one 930 Mbps—is only really about 700 Mbps on average.
Upload speeds are more consistent, so I begrudgingly pay for this high-tier plan... But I'd be a lot happier with 50 or 100 Mbps of asymmetric data, since I'm not downloading terabytes of files every day.
Starlink monitoring
The main reason I set this stuff up was to compare my Gigabit Cable Internet to SpaceX's Starlink Internet.
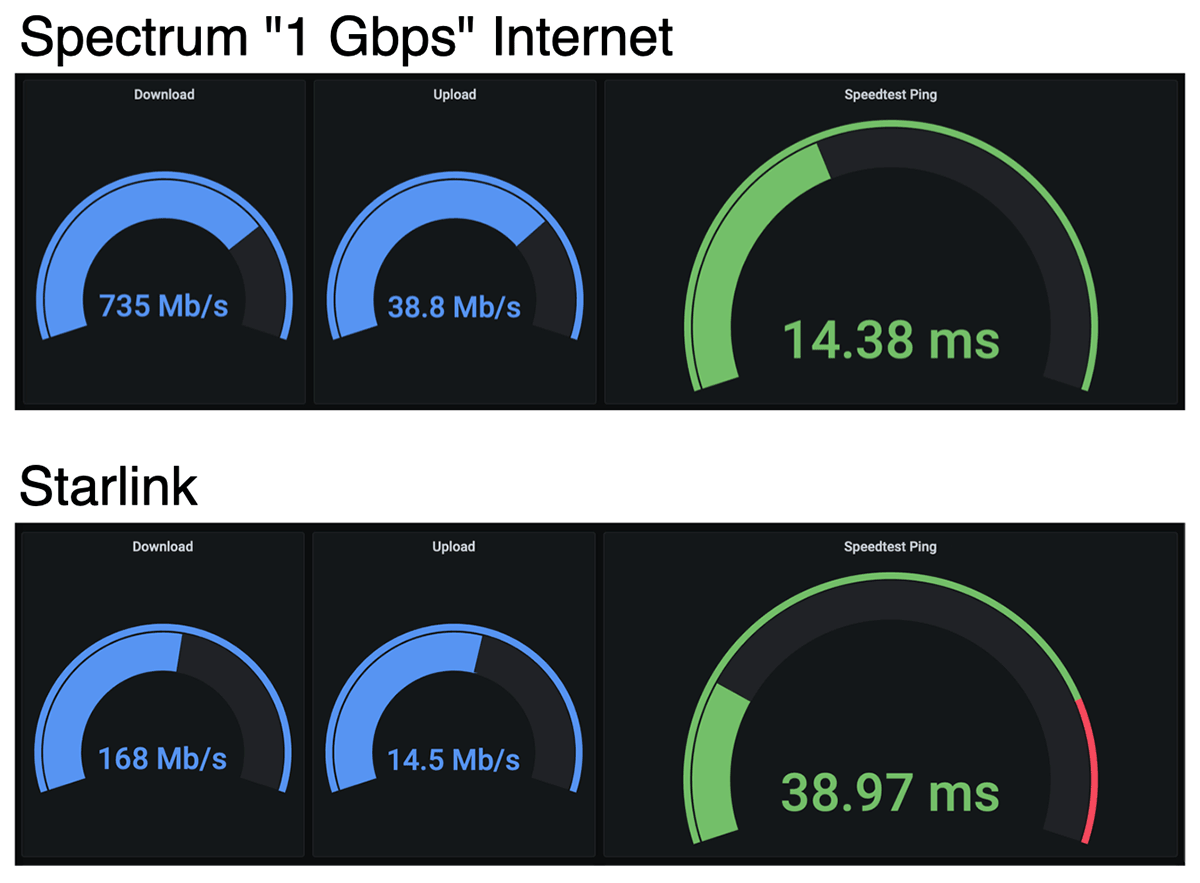
I'll get more into Starlink in a future review, but it looks like on average, when it has a stable connection, I get over 150 Mbps down, and 15 Mbps up, with 40 milliseconds of latency.
Those numbers are less than my Cable ISP; but Starlink also costs less—it's $99/month. And Starlink is also beaming the Internet through satellites up in the sky! For someone who doesn't have a fast Cable option (like rural customers), that's a mind-blowing upgrade from dial-up speeds.
But I mentioned earlier, there's also a Starlink-specific dashboard that gives all the details you'd normally find in the Starlink App.
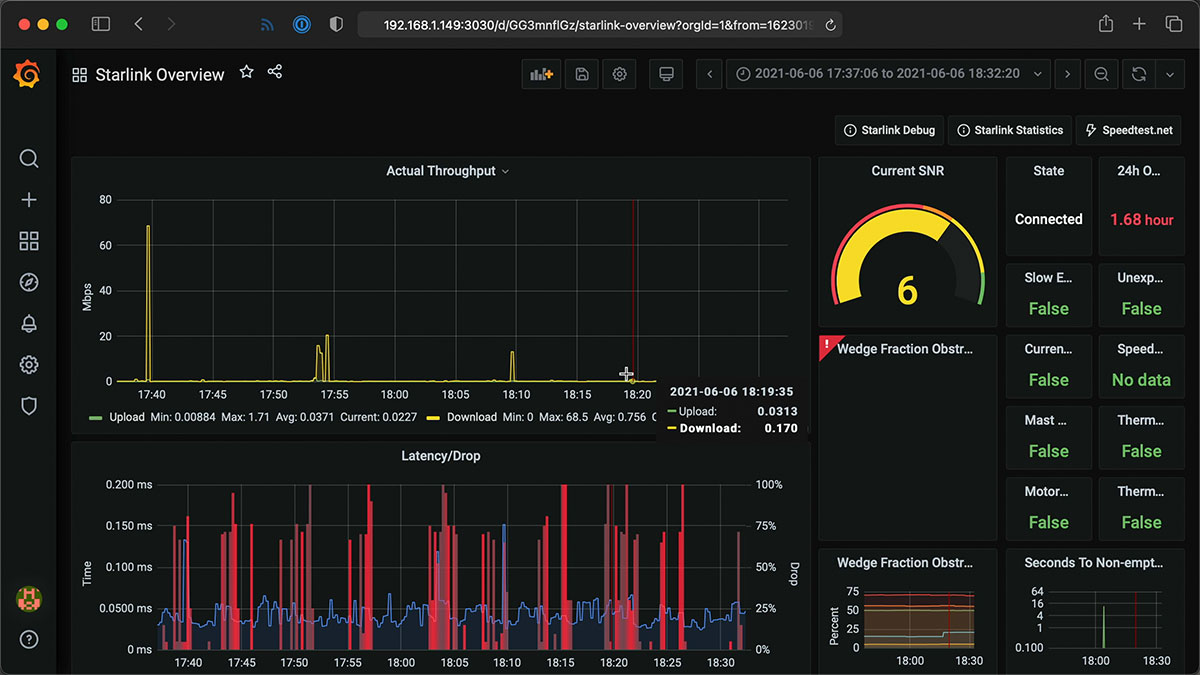
I haven't been actively using the Starlink connection today, so it's a little barren, but it gives a ton of detail, and I'd like to thank Daniel Willcocks (DanOpsTech) for making this possible; I'm using his Docker image and dashboard, and he even adjusted it to work on the Raspberry Pi after I asked about it!
Power monitoring
I also monitor Starlink's power consumption using a Shelly Plug US and a custom Shelly Plug Prometheus exporter I wrote:
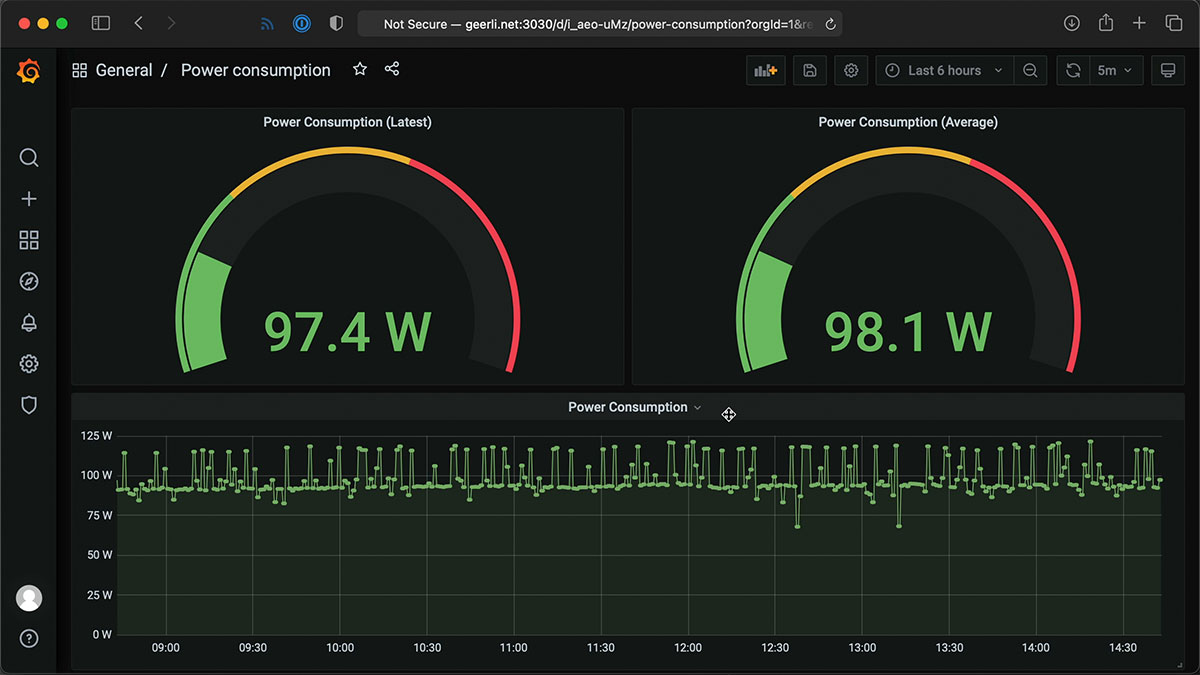
Starlink's dish and router use a lot of power (more than you might expect)—but I'll discuss more about that in my Starlink review coming soon! I have a blog post with more about how I set up the Shelly Plug power monitoring.
Conclusion
Now I know exactly how much my ISP is fleecing me for Internet. In Spectrum's case, it looks like they're only giving me about 3/4ths of what I pay for.
I wish I could just pay them $110 a month instead of $150, but if I did that, they'd cancel my service!
I'd like to thank Max Andersen for the original inspiration for the original monitoring configuration, the developers behind Pi-hole for making it free and open source, and especially Miguel who maintains the speedtest exporter, for his help getting some bugs fixed!
Comments
Did you ever get this figured out? I (and at least two other people in these comments) have the same problem but there have been no replies to any of the comments about it.
On a fresh new Rpi OS, I follow the instructions exactly and, when I runt he playbook, I get the error. My line 26, however, is "-name: Include handlers."
Yes this error is seen my many and not answered. I spent wasted two days on this project and now I am done with no joy. The instructions are badly written and assume many things without saying what is required.
I hit this issue and had to uninstall Ansible via apt and install it via Python3 (using Pip).. Also, you need to target specific versions of ansible that have ansible-core available (or upgrade Python3).. Search closed issues on Jeff's internet-pi github for other problems/solutions - it helped me!
This is a really useful project, I already had PiHole running so have just expanded it with the speedtest/ping dash, thanks Jeff.
Couple of quick questions,
1. If I wish to add/change the speedtest frequency or pinged sites post setup, can this be done from the dash/CLI or does the playbook need to be re-run?
2. I have a Pi running a python script that reads and displays JSON data from the PiHole api.php on a small LCD. Is there any way of extracting the results in the Grafana dash (in JSON preferably) so I could also display this on the LCD
Appreciate your time.
You would need to change the
config.ymlfile then run the playbook again. And to get the data out to the LCD, the easiest thing would be to query Prometheus directly over HTTP for those values (using PromQL); you can edit one of the dashboard panes to see the PromQL query it's using to get the data.Cheers Jeff, much appreciated. Keep up the good work.
I already have PiHole installed on a pi. Following these instructions will it break my current installation?
Just set
pihole_enabletofalsein yourconfig.ymland it'll be good to go.Hi Jeff
Great tutorial, first time pi users and it was very helpful. No issues through the install, I already had Pi-hole configured as a recursive DNS so didn't want to make any changes there so just set install to false.
For internet monitor, I already had a bare grafana installation, I had assumed it would update my existing but it looks like I have two now - one running on port 3000 (original) and (the internet-monitor one) running on port 3030.
Is there a simple way to remove the original install/port 3000 instance without mucking up the internet-monitoring one? Worse case I can just do a full grafana uninstall and re-run playbook to set it up again, but though there might be quicker method.
Thanks,
Mark
This is what I get at the end when trying to run it:
failed: [127.0.0.1] (item=example.config.yml) => {"ansible_facts": {}, "ansible_included_var_files": [], "ansible_loop_var": "item", "changed": false, "item": "example.config.yml", "message": "Could not find or access 'example.config.yml'\nSearched in:\n\t/home/pi/internet-pi/vars/example.config.yml\n\t/home/pi/internet-pi/example.config.yml\n\t/home/pi/internet-pi/vars/example.config.yml\n\t/home/pi/internet-pi/example.config.yml on the Ansible Controller.\nIf you are using a module and expect the file to exist on the remote, see the remote_src option"}
Hello guys,
I tried this on my Raspberry Pi, and after a bunch of errors that I was able to fix I got to a point and... I don't know what to do. Would someone help me, please?
---
pi@raspberrypi:~ $ ansible-playbook main.yml
[DEPRECATION WARNING]: Ansible will require Python 3.8 or newer on the
controller starting with Ansible 2.12. Current version: 3.7.3 (default, Jan 22
2021, 20:04:44) [GCC 8.3.0]. This feature will be removed from ansible-core in
version 2.12. Deprecation warnings can be disabled by setting
deprecation_warnings=False in ansible.cfg.
ERROR! the playbook: main.yml could not be found
---
Thank you in advance!
I was able to install Python 3.9.6, but nothing works. I'm getting a bunch of errors, unfortunately.
So frustrating...
Most likely you're in the root directory rather than where the file is located. Try the following command: cd internet-pi
Once in that directory you should be able to run the command and it will find the file.
Hello Jeff I really like the software and what it does grafana is what i was looking for to run speed test and let my ISP know I am not getting what I pay for... or at least complain to make me feel better :) Now I moved the PI to my rack where the switch is installed and now I cannot get to 3030. logically on the same segment. How can I check if grafana should be working... any commands I can run? thanks in advance...
You can run
docker psto see the status of all the containers. Should be agrafanacontainer that's 'Running'.this is what I see...
I hate that it was running I moved it and now 3030 does not respond.. I can get to ports 9115, 9090, 9100 just not 3030... UGH. Might just start over.. thanks
Seeing that "Up 2 seconds" seems to indicate there's an issue with Grafana running correctly. Try doing
docker logs internet-monitoring_grafana_1and see what that shows you.It could be related to this issue: https://github.com/geerlingguy/internet-pi/issues/8
I tried uncommenting the name_server127.0.0.1 but now pi-hole and Grafana do not work.. I will rebuild it. Thanks
Dabbling into your "ISP LYING" (monitor your ISP) and I have some issues. I'm sure I really ~do~ have issues, but that's not why I write. Preliminary I got off to a good start (Make sure you have Ansible installed:
(If pip3 is not installed) sudo apt-get install -y python3-pip
pip3 install ansible
Download the internet-pi repository to your computer: git clone https://github.com/geerlingguy/internet-pi.git && cd internet-pi
Install the Ansible Galaxy content that's required to make the playbook work: ansible-galaxy install -r requirements.yml
That is where I get the error:
pi@raspberrypi:~/internet-pi $ ansible-galaxy install -r requirements.yml
-bash: ansible-galaxy: command not found
Upon reading a little about it, it would seem that the versions of (what?: pip, python, ansible) all come into question.
So how would you recommend checking of all these components to get them to the correct level?
Thank you- I really do enjoy learning - while I am still somewhat stuck-at-home! You hit that right on. /EricG
The ansible playbook is super broken on Raspbian. all error messages are cut short and as text as I have no idea how to format it properly.
First pip3 install of docker crashes with "Could not find a version that satisfies the requirement docker[ssh]>=5 (from docker-compose)" . This might be the only error, and everything I made after this is just follow-on errors.
I apt-get docker and docker-compose, check that both behaves as expected. I comment out the pip3 install.
Next key management fails with "Warning: apt-key output should not be parsed", commenting out the key management predictably makes back-ports maneuver fail too, so I manually try to install libseccomp2, but gets back that my currently installed version supersedes the one in backports, slightly concerned I decide to ignore that lib file as I am on a 64-bit OS.
Again probably making things worse. more editing of yml files to jump forward.
And finally we are getting to the actual docker-compose part. Aaaand it fails with, "fatal: [127.0.0.1]: FAILED! => {"changed": false, "msg": "Configuration error - Version in \"/root/internet-monitoring/docker-compose.yml\" is unsupported. You might be seeing this error because you're using the wrong Compose file version. Either specify a version of \"2\" (or \"2.0\") "
This is where I gave up. I might try to clean up this mess I (this is all my fault I a certain) made and just set it up "by hand" as I find it an intriguing idea to use speedtest like this. Also it feels like I missed something in the beginning that messed everything up.
The install instructions are tested on Raspberry Pi OS (based currently on Debian Buster); but it should work on Raspbian too. I'd search through the issues on GitHub if you're having a problem (most of the things you noticed are already mentioned in one issue or another there), or post an issue if you're still running into issues.
The easiest way to install is to flash a fresh up-to-date copy of Pi OS to a microSD card, then start from there.
Ahh. My mistake, I thought Raspbian and Raspberry Pi OS was the same.
After doing a clean install of the supported OS, the instructions and playbook worked almost flawlessly, the only hiccup was a known issue, the privilege error for the docker socks file. That was easily fixed with chmod 777, I know it is bad practice, but it is an easy fix for an internal system.
But sadly, my PI 3a doesn't handle 1000 Mbit/s, it maxes out at 300 mbit/s. So using to monitor my connection speed is not very useful.
Thanks for this Jeff
This is fantastic! Worked for me after replaying the ansible playbook a 2nd time. The only other thing I'd like to see is a daily check on the remaining disk space on the PI, as I'm guessing it will increase steadily every day while storing all the data. Is there an easy way to 1) regularly check the disk space and 2) graph this on Grafana? Thanks!
It is possible to graph that kind of data in Prometheus / Grafana—but one note on disk usage, it's in the low MB range, and Prometheus deletes all data older than 15 days by default.
How about a Docker version?
Everything is run in Docker containers—the Ansible playbook only exists to set them all up correctly.
Thank you Jeff this is terrific!
Is there a way to add another Shelly Plug to monitor?
I tried duplicating the entry in the config.yml but got a bunch of
Warnings: Duplicate Entry and 'Using last defined value only' statements after re-running the playbook.
Everything else has been working great.
Please check out this issue on GitHub: Feature request: Monitor multiple shelly plugs.
Hello Jeff I hope you and your family are doing well
I'm writing to you from Quebec Canada..
First id like to say thank you for all that you do, you are a great inspiration to me as a noob in this area on tech,
I was a tech for about 8 years and now was put in a system Admin position so im like a french canadian without anywhere to eat poutine( dumb joke if you dont get it i dont blame you LOl)
anyways your videos and books are a good help and you are a funny guy so keep it up..
NOW to my issue ,
I have setup my Pi to this internet-pi but i keep getting an error when i run the playbook , seems the only issue i have is with pihole and it keeps giving me this error when it is at section
TASK [Ensure Pi-hole is running.]
fatal: [127.0.0.1]: FAILED! => {"changed": false, "errors": [], "module_stderr": "Starting pihole ... \nHost is already in use by another container\nStarting pihole ... error\n", "module_stdout": "", "msg": "Error starting project Encountered errors while bringing up the project."}
any ideas?
sorry for the long post
Thanks
Christian
Sorry replying back to my comment , i tried to do the same on a PiOS 32b it (my issue was on ubuntu server 20.04)
and since i have 2 ISP's in my home (testing and my main isp) its working on my dev isp ..
so seems the issue is with ubuntu , i will try again to start fresh on ubuntu to make sure it wasnt a human error.
sorry for posting before even testing another solution
Hi, I got successful results on every step until the last one, running sudo ansible-playbook main.yml yields this output:
[WARNING]: Unable to parse /home/curly/internet-pi/inventory.ini as an
inventory source
[WARNING]: No inventory was parsed, only implicit localhost is available
[WARNING]: provided hosts list is empty, only localhost is available. Note that
the implicit localhost does not match 'all'
[WARNING]: Could not match supplied host pattern, ignoring: internet_pi
PLAY [internet_pi] *************************************************************
skipping: no hosts matched
PLAY RECAP *********************************************************************
My inventory.yml file looks like this:
[internet_pi]
#10.0.100.52 ansible_user=pi
# Comment out the previous line and uncomment this to run inside Rasberry Pi.
127.0.0.1 ansible_connection=local ansible_user=pi
Any ideas what I could be doing wrong? Does the pi user need to be created in advance?
Hi sorry to buttin,, are you doing this directly from your PI or on a different machine ?
Hi Jeff, if the Pi reboots, will this automatically restart?
Yes; it sets up a series of Docker containers that are set to always run and Docker will restart them automatically when needed (including after a restart or fresh boot).
Is there a way to pause and re-start the internet monitoring service? So far it is set up and running perfectly.
Yes; you can go into the internet-monitoring directory and run
docker-compose stop, thendocker-compose startwhen you want it running again.Step three causes this (after a Python deprecation warning):
ERROR! The requirements file '/home/pi/requirements.yml' does not exist.
Help?
Never mind. I had to switch to the internet-pi directory first.
Hi Jeff!
Love watching your videos! Also, quick question about this pihole/monitoring project.
I attempted to follow the installation process but when i get to the point to start the playbook using "ansible-playbook main.yml" it starts to go through the tasks but at the very end it gives me the following:
TASK [Ensure Pi-hole is running.] **************************************************************************************
fatal: [127.0.0.1]: FAILED! => {"changed": false, "errors": [], "module_stderr": "Starting pihole ... \nHost is already in use by another container\nStarting pihole ... error\n", "module_stdout": "", "msg": "Error starting project Encountered errors while bringing up the project."}
Not sure what to do to fix this, the pihole won't run due to this error. Any help is appreciated.
Running on Ubuntu 20.04? If so, the dns resolver is using port 53 which is causing Pi-hole to fail to install. I migrated to dnsmasq following step 1 (ignore the rest) here https://computingforgeeks.com/install-and-configure-dnsmasq-on-ubuntu/
I set the port to 5353 and reran the playbook and that solved my issues. There may be other ways around this.
Where did you change the port? on DNSMasq?
Running this with only internet monitoring. Got it setup and everything seems to work but the download and upload graphs and when it does a refresh I get "Annotation Query Failed e is undefined". Any idea how I can fix this?
The message above was from Firefox. This is the message from chrome.
Annotation Query Failed
Cannot read property 'to' of undefined
I got this message from the developer tools console in chrome.
centrifuge.js:544 WebSocket connection to 'ws://192.168.1.30:303
That IP is my Pi, not sure what port is 303 or if it just got truncated.
I have installed everything on a virtual ubuntu server, when I try to run a ping or speedtest fromthe web interface I get a 'Annotation query failed e is undefined"
Awesome video & presentation!!! I have this error and it exits. Not sure how to resolve it.
TASK [Ensure internet-monitoring environment is running.] **********************************************************************************************************
fatal: [127.0.0.1]: FAILED! => {"changed": false, "msg": "Error connecting: Error while fetching server API version: ('Connection aborted.', PermissionError(13, 'Permission denied'))"}
Reboot and run the playbook again
I have an error with inventory.ini so I dropped the ^g in the below line. I don't think this was the fix. Any suggestions?
127.0.0.1 ansible_connection=local ansible_user=pi ^g
^g
I am more than willing to share more information but the spam filter flags me as Forbidden. Contains contacts. Message seems to be spam.
I look forward to the collective wisdom to help me resolve my issue. Tell me how to share more detail......
Cheers!
NOOB warning
Running ansible-playbook it fails on Ensure Pi-Hole is running. Note I changed my real password with "mypass$" .
TASK [Ensure Pi-hole is running.] **********************************************
fatal: [127.0.0.1]: FAILED! => {"changed": false, "msg": "Configuration error - Invalid interpolation format for \"environment\" option in service \"pihole\": \"mypass$\""}
PLAY RECAP *********************************************************************
127.0.0.1 : ok=15 changed=0 unreachable=0 failed=1 skipped=7 rescued=0 ignored=0
pi@raspberrypi:~/internet-pi $
Thoughts, thanks
Thank you very much for these great guides and tutorials.
I originally set this up toying with a wifi network and had the pi set to its DHCP address for access. It worked, but on moving it to a more permanent home and connecting to a static ethernet ip, I found that the pi-hole software had the older address configured.
In order to change the ip, the pihole docs have me run `pihole -r` in order to reconfigure it. However, since we are running in a docker container, it seems the best way to change was to change the ansible playbook with my new static ethernet ip and re-run it: `ansible-playbook main.yml`
So that works great, but uncovers my lack of understanding of docker. Is it possible to interact inside the docker container directly, so that I can run `pihole -r`?
With docker 1.3, there is a new command docker exec. This allows you to enter a running container:
docker exec -it [container-id] bash
Finally got everything working and I am getting an error in Grafana "Annotation Query Failed
Cannot read property 'to' of undefined". Not sure what to do, a bit new at all this.
It's not you, it's a new bug; check out this issue: Annotation query failed on Internet dashboard in Grafana.
I am wanting to run this in an Ubuntu VM on my Synology and think I have a set of instructions that will work for others interested in installing this on Ubuntu 20.04. It includes a lot of the fixes and work arounds found in the issues section of the github. Feel free to throw this up on the Github page.
Ubuntu "Internet-Pi" Install
Prereqs
This is based off Ubuntu 20.04 server and running the setup locally or connecting directly via SSH.
1. When installing Ubuntu, user name options:
Option 1: Create the user pi to make this go easier
Option2: Create a new user with sudo access called pi
Option 3: Update the inventory.yml during the setup with the account of your choice
Note: This has only been tested by me using pi as the initial user account
2. Update ubuntu: sudo apt update && sudo apt dist-upgrade -y
3. Migrate to using Dnsmasq
Note: Ubuntu 20.04 runs a DNS service that will break the Pi-hole install since it is using port 53. Dnsmasq will allow for using another port, i.e., 5353.
Resource from: https://computingforgeeks.com/install-and-configure-dnsmasq-on-ubuntu/
1. sudo systemctl disable systemd-resolved
2. sudo systemctl stop systemd-resolved
3. ls -lh /etc/resolv.conf
4. sudo rm /etc/resolv.conf
5. echo nameserver 1.1.1.1 | sudo tee /etc/resolv.conf
6. sudo apt-get install dnsmasq -y
7. sudo nano /etc/dnsmasq.conf
Note: Here is minimal configuration
# Listen on this specific port instead of the standard DNS port
# (53). Setting this to zero completely disables DNS function,
# leaving only DHCP and/or TFTP.
port=5353
# Never forward plain names (without a dot or domain part)
domain-needed
# Never forward addresses in the non-routed address spaces.
bogus-priv
# By default, dnsmasq will send queries to any of the upstream
# servers it knows about and tries to favour servers to are known
# to be up. Uncommenting this forces dnsmasq to try each query
# with each server strictly in the order they appear in
# /etc/resolv.conf
strict-order
# Set this (and domain: see below) if you want to have a domain
# automatically added to simple names in a hosts-file.
expand-hosts
# Set the domain for dnsmasq. this is optional, but if it is set, it
# does the following things.
# 1) Allows DHCP hosts to have fully qualified domain names, as long
# as the domain part matches this setting.
# 2) Sets the "domain" DHCP option thereby potentially setting the
# domain of all systems configured by DHCP
# 3) Provides the domain part for "expand-hosts"
#domain=thekelleys.org.uk
domain=mypridomain.com
# Set Listen address
listen-address=127.0.0.1 # Set to Server IP for network responses
8. sudo systemctl restart dnsmasq
9. Verify nothing is running on port 53: sudo ss -tulpn
Setup
1. Install Ansible. The easiest way (especially on Pi or a Debian system) is via Pip:
a. sudo apt-get install -y python3-pip (If pip3 is not installed)
b. pip3 install ansible
c. sudo reboot now (reboot to make sure the command ansible-galaxy will work)
2. Clone this repository: git clone https://github.com/geerlingguy/internet-pi.git
3. Enter the repository directory: cd internet-pi
4. Install requirements: ansible-galaxy collection install -r requirements.yml
- sudo reboot now (may not be needed but this makes sure things are fully in place)
5. Make copies of the following files and customize them to your liking:
a. cd internet-pi
b. cp example.inventory.ini inventory.ini
i. nano inventory.ini
Comment the second line starting with 10 abd uncomment the last line starting with 127 as shown below. Also note if you are using a user other than pi, change ansible_user=pi to the other username
[internet_pi]
#10.0.100.52 ansible_user=pi
# Comment out the previous line and uncomment this to run inside Rasberry Pi.
127.0.0.1 ansible_connection=local ansible_user=pi
c. cp example.config.yml config.yml
i. nano config.yml
Modify this file to meet your requirnments. At a minimum change the timezone and password
6. Run the playbook: ansible-playbook main.yml --ask-become-pass
- When "BECOME password:" comes up enter the user password (in my case the password for pi)
- Normal: An error will occur with permission denied (fatal: [127.0.0.1]: FAILED! => {"changed": false, "msg": "Error connecting: Error while fetching server API version: ('Connection aborted.', PermissionError(13, 'Permission denied'))"})
- sudo reboot now
7. Run the playbook again:
1. cd internet-pi
2. ansible-playbook main.yml --ask-become-pass
- When "BECOME password:" comes up enter the user password (in my case the password for pi)
Done!
When running the playbook, everything works but pihole itself. I get an error when it trys to start pihole. I did have pihole installed on this before in a docker container. I am running this on Ubuntu 20.04-arm64 on the ESXi hypervisor. I have deleted the old container and image.
fatal: [127.0.0.1]: FAILED! => {"changed": false, "errors": [], "module_stderr": "Creating pihole ... \n\u001b[1A\u001b[2K\nCreating pihole ... \n\u001b[1B", "module_stdout": "latest: Pulling from pihole/pihole\nDigest: sha256:b51628bfa49b71ce4af4831b34e276693a6d647b82037151d8eb0d34da504432\nStatus: Downloaded newer image for pihole/pihole:latest\n", "msg": "Error starting project Encountered errors while bringing up the project."}
Im stuck on step 3:
pi@raspberrypi:~/internet-pi $ ansible-galaxy install -r requirements.yml
-bash: ansible-galaxy: command not found
Reboot and try again
Hello thank you for all of your great work! I am trying to get this all running but i am running into this error
fatal: [192.168.1.32]: FAILED! => {"changed": false, "msg": "Error connecting: Error while fetching server API version: ('Connection aborted.', PermissionError(13, 'Permission denied'))"}
I am currently on armbian (basically Ubuntu 20.04) with my odroid at 192.168.1.32 being used to run the services. I think part of the issue is from docker as when i tried to install docker ce i get this error
Reading package lists... Done
Building dependency tree
Reading state information... Done
Package docker-ce is not available, but is referred to by another package.
This may mean that the package is missing, has been obsoleted, or
is only available from another source
E: Package 'docker-ce' has no installation candidate
I am going to try to update to 21.04 and see if that helps with anything,
Please let me know if you need any more info thanks again!
I just reset everything and tried again and i got further this time but got stuck at this error. I am using my odroid as the host so i commented the first line and uncommened the second line in the inventory config.
fatal: [127.0.0.1]: FAILED! => {"changed": false, "errors": [], "module_stderr": "Creating pihole ... \nHost is already in use by another container\nCreating pihole ... error\n", "module_stdout": "latest: Pulling from pihole/pihole\nDigest: sha256:b51628bfa49b71ce4af4831b34e276693a6d647b82037151d8eb0d34da504432\nStatus: Downloaded newer image for pihole/pihole:latest\n", "msg": "Error starting project Encountered errors while bringing up the project."}
Trying to reach my ip doesnt work.
rebooting did not work ether
Something else is probably using port 53 (port 53 is the default DNS port). Check to see what is using port 53 (in Ubuntu run sudo lsof -i :53) and find a way to disable or move it to another port. See my prereqs on my long post from a week ago on installing Internet Pi on Ubuntu 20.04. That may help.
Hi Jeff,
First off awesome blog and this works like a dream.
One thing that I am not getting right is to update the Pi-Hole interface to the latest version.
""Pi-hole v5.3.1 Web Interface v5.5 · Update available!""
So went to the github page and followed the docker commands,
cd ~/pi-hole #
docker-compose pull # pulls the latest images
docker-compose up -d --no-deps # restarts containers with newer images
docker system prune --all # deletes unused images
rebooted the pi and logged in and the web ui of pi hole still says the below:.
""Pi-hole v5.3.1 Web Interface v5.5 · Update available!""
Am I doing something wrong here or did i run something odd?
Other than that, this has been a learning experience in devops world which is what i attempting to study (^^,)
Thanks to all for the awesome work here.
The update must be done inside the PiHole Docker container with the command 'pihole -up'.
To enter the container read my post i did a few days ago, use the docker exec command.
Hi CrashB,
ran this -> docker exec -it MY_CONTAINER_ID pihole -up
Get this answer:
Function not supported in Docker images
Can you please provide the full command?
I can ssh into the container fine with docker exec -it MY_CONTAINER_ID bash, but i dont think updaing the pihole via this method is great.
*PS - MY_CONTAINER_ID is redcuted
You maust enter the container!
Try: docker exec -it [container-id] bash
then u get a shell inside the container.
Inside the container u can enter the command pihole -up
so following that method, i get into the container
i run the pihole -up command and get
"Function not supported in Docker Images"
I have done some web searching and a few sites have it mention of the above error, others mention watchtower and portainer. Should i give them a go and see if it does the updates or not?
Sorry, you are right, Update or reconfigure won´t work.
I only changed my webpassword in the pihole container.
Docker containers are made to be deleted and replaced with newer versions. Upgrading the same container to a new version is not supported.
Sad but true.
But ssh into the container is the only method i know.
What about running a cronjob inside the pihole container which updates regurlarly. Each week or month for instance.
Ok, i am not a pro in docker, but as i understand the project, it seems to be that pihole will be updated if you run the command
ansible-playbook main.yml
again.
This loads the newest pihole docker container.
My version is up to date after that command.
;-)
Im getting this error: fatal: [my ip]: UNREACHABLE! => {"changed": false, "msg": "Failed to connect to the host via ssh: main@my-ip: Permission denied (publickey,password).", "unreachable": true}
Any idea how to fix this?
Thanks for this material, works like a charm!
I'm only a bit concerned though, about how this system could damage the microSD in the long run because of its continuous writes to the filesystem -- I'd rather have something that only flushes writes every few minutes.
Have you given this topic some thought?
I tried adding "commit=300" to mount options for "/", but iostat reports rather frequent writes to /dev/mmcblk0 anyway (when the containers are running). Any suggestion?
Thanks!
Thanks for the great tutorial, i managed to get it up and running. However i dont reside in the US and i wish to know my local speed.
Will it work if i modify github, apple and google to anything else?
Is there a way to record the packet and byte usage on the Pi ethernet port to see how much bandwidth is being used by the PI to do the monitoring? Ideally, it would be added as a visualization in Grafana
I followed your guide and when I input the run playbook command I get;
error! the playbook main.yml could not be found
What am I doing wrong
ERROR when running ansible-playbook mail.yml - any suggestions?
Inventory set as below:
=====================================================
pi@raspberrypi:~/internet-pi $ cat inventory.ini
pi@raspberrypi:~/internet-pi $ cat example.inventory.ini
[internet_pi]
#10.0.100.52 ansible_user=pi
# Comment out the previous line and uncomment this to run inside Rasberry Pi.
127.0.0.1 ansible_connection=local ansible_user=pi
=============================================================
ERROR Message
pi@raspberrypi:~/internet-pi $ ansible-playbook main.yml
[WARNING]: * Failed to parse /home/pi/internet-pi/inventory.ini with ini plugin: /home/pi/internet-pi/inventory.ini:1: Expected key=value host variable assignment, got:
$
[WARNING]: Unable to parse /home/pi/internet-pi/inventory.ini as an inventory source
[WARNING]: No inventory was parsed, only implicit localhost is available
[WARNING]: provided hosts list is empty, only localhost is available. Note that the implicit localhost does not match 'all'
[WARNING]: Could not match supplied host pattern, ignoring: internet_pi
[WARNING]: ansible.utils.display.initialize_locale has not been called, this may result in incorrectly calculated text widths that can cause Display to print incorrect
line lengths
PLAY [internet_pi] ***********************
skipping: no hosts matched
PLAY RECAP ***************************
Nice tutorial, Jeff!
Since I already have a Pi4 up and running with PiHole on it, I'd like to add the Grafana dashboard on top of it. What would be involved to just add that without going through your whole from scratch tutorial? :)
Hi Jeff - me again! I'd like to do a fresh install, but without PiHole (I already have a couple of PiHoles set up). Would this just involve changing pihole_enable from True to False in config,yaml?
Never mind - I've just found that you answered this in an earlier comment!
Really nice tutorial, Jeff. I'm trying to install it on a pi 4, where I updated python to 3.9, but when I run "ansible-playbook main.yml", I keep getting the following error:
[WARNING]: Updating cache and auto-installing missing dependency: python3-apt
fatal: [127.0.0.1]: FAILED! => {"changed": false, "msg": "python3-apt must be installed and visible from /usr/bin/python."}
I have reinstalled python3-apt multiple times and python3-apt (1.8.4.3) is installed on the pi.
I would be grateful for any pointers.
Hi Jeff! Greetings from Guam.
Your video was the final push I needed to buck up and buy my first Raspberry Pi. I was able to build the unit and get your configuration going in a couple of days. That was a lot of fun, thanks!
Question I have is can I share my dashboard live over the internet? I'd like to show my friends how this looks and what the performance of our internet is (yes, we're the ISP!). This provides a much more detailed view than we're able to get from our network KPI.
Thanks again for sharing this. It's been a lot of fun to get running and analyze the results.
Jim...
Hi Jeff,
Kind of stuck in trying to install galaxy (V4.5.0) as ansible-galaxy install -r requirements.yml only leads to ansible-galaxy: command not found
Even ansible --version comes up as command ansible: command not found. I am new to this so seem to be missing something probably obvious but I cant get it running.
Cheers Hawkeye
Reboot and try again
Could you make an explanation for people wanting to use Portainer to set this up? I am still learning, and it would be great to get a few extra tips.
I already have a Pi4 8GB runnning a couple of containers. But I would absolutely LOVE to be able to measure the speed to my ISP.
Morning all,
So I tried this yesterday and great! All installed and working (configured as my DHCP server too), but the stats aren't displaying...
As the playbook wouldn't run, I installed everything manually, them installed the monitoring dashboard from your archived project.
When I load the dashboard, I get "Annotation Query Failed
Cannot read properties of undefined (reading 'to')".
The http checks are populating, but the speediest checks are all displaying N/A.
Any ideas?
Cheers!
I just installed yesterday and have the same issue.
Hi Jeff, thank you again for the awesome work. I was just looking at the project yesterday and thinking that I should be able to just take it and deploy it on my Kubernetes cluster. I am running K3s in a mixed cluster with a few Raspberry Pi 4 and some VM with Rancher. I am new to this, but moving it to the cluster should be a good way to learn more. So I will have a look at the docker files and see if I can bring everything over. Any recommendation for me or specific things that I should be careful about?
Thanks !
Ok It was not to difficult. I did convert everything with Kompose and had to make some adjustments. The biggest one where the volumes since a few of them are really Config Maps in Kubernetes. I've just converted the respective files or directory to Config Maps and upload them first to my K3s Cluster. For now I have removed the other stuff (Shelly and Node Exporter), but I will probably re add them later. Almost forget, I also had to manually replace the variables in the templates for the real values. No perfect, but it is working. Did i learn something? Yes, all about config maps !
Hello:
I ran the docker updater the Internet Monitor yesterday and was getting the annotation query in Grafana, so I set it back to 8.0.6 per another user here and that removed the error. But, the speedometer gages are no longer updating and have been at the same upload/download reading for two days. The bar graphs are updating fine. This issue with the speedometer type gages happened before I rolled back Grafana to 8.0.6. Any ideas to fix this?
Thanks!
I had some time to poke this PI harder this afternoon and I'm in the Prometheus web GUI on ports 9090. When I go to Targets, I see all the targets for the Internet monitoring and Speed test is in a state of "Unknown". The endpoint is http://speedtest:9798/metrics. All other targets show state "Up".
There's my sign, but not sure where to go from here. Just learning all the tools you used for this project Jeff, excuse my rookieness. Great effort and much appreciated. I ordered all the parts for your air quality project the other day BTW, YAY!
Thanks
Peter
It would be nice if this could also use/compare other servers/services except speedtest.net. Access providers are known to prioritize popular speedtest sites and run speedtests nodes within their network. You could be seeing the maximum speed of your modem and providers local network, instead of your actual internet connectivity.
Maybe for a technical speedtest and evaluation Starlink you DO want to prioritize so your test is not influenced by whatever other traffic is going on on your (access provider's) network, but I'm more interested in real world performance.
I've seen less well known speedtest sites and real world file transfers all showing a fairly low (but similar) speed while speedtest.net was getting high speeds. Speedtest.net results often seem fishy.
But that's all anecdotal and just a gut feeling. That's why it could be nice to collect data comparing speedtest.net to other sources.