Internet Service Providers are almost universally despised. They've pushed for the FCC to continue defining 25 Mbps as "high use" broadband, and on top of that they overstate the quality of service they provide. A recently-released map of broadband availability in the US paints a pretty dire picture:

Here in St. Louis—where I guess I should count my lucky stars we have 'high use' broadband available—I have only two options: I can get 'gigabit' cable Internet from Spectrum, or 75 megabit DSL from AT&T.
That's it.
And you're probably thinking, "Gigabit Internet is great, stop complaining!"
But Spectrum's "gigabit" Internet is 930 megabits down—in ideal conditions—but only 40 megabits up. And that's the highest plan that costs about $150 a month!
Some would die for those speeds (see the map above), but much of the world is better off. And are you really getting the speeds you pay for? You probably don't know.
Well, I do, thanks to a $35 Raspberry Pi! And you don't even need a Pi, you could run the software I use on any computer. I just like having a dedicated computer to run all my Internet connection tools, so it's easy to backup or replace, and it doesn't get bogged down.
Video
I have a video that goes along with this blog post, and it's embedded below; skip past it if you prefer reading over viewing.
My Internet Pi
This is my "Internet Pi" (hostname geerli.net):
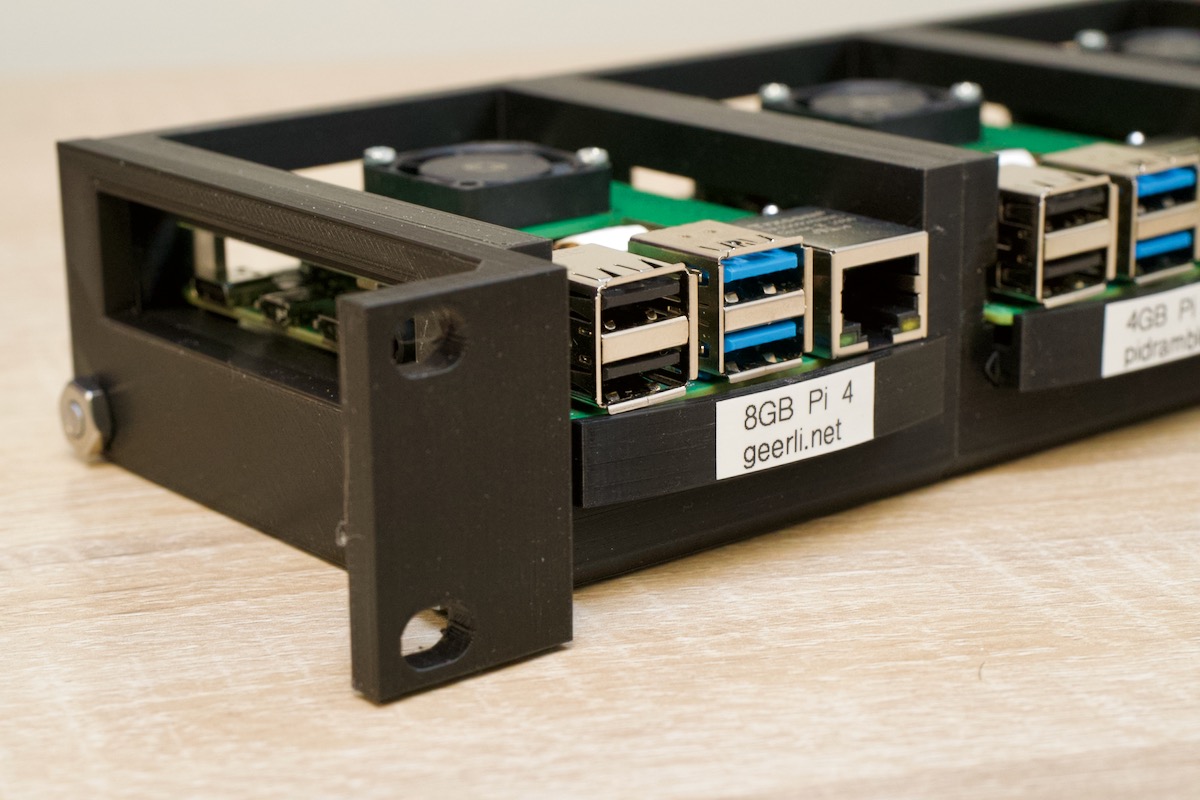
I have it installed in a rack (here's a video on the Pi rack), but it could just as easily be on my desk, or sitting by my Internet router.
The most important thing for measuring a network connection is that it's wired. WiFi, especially on the Pi, fluctuates quite a bit and is terrible for monitoring anything besides maybe WiFi signal strength.
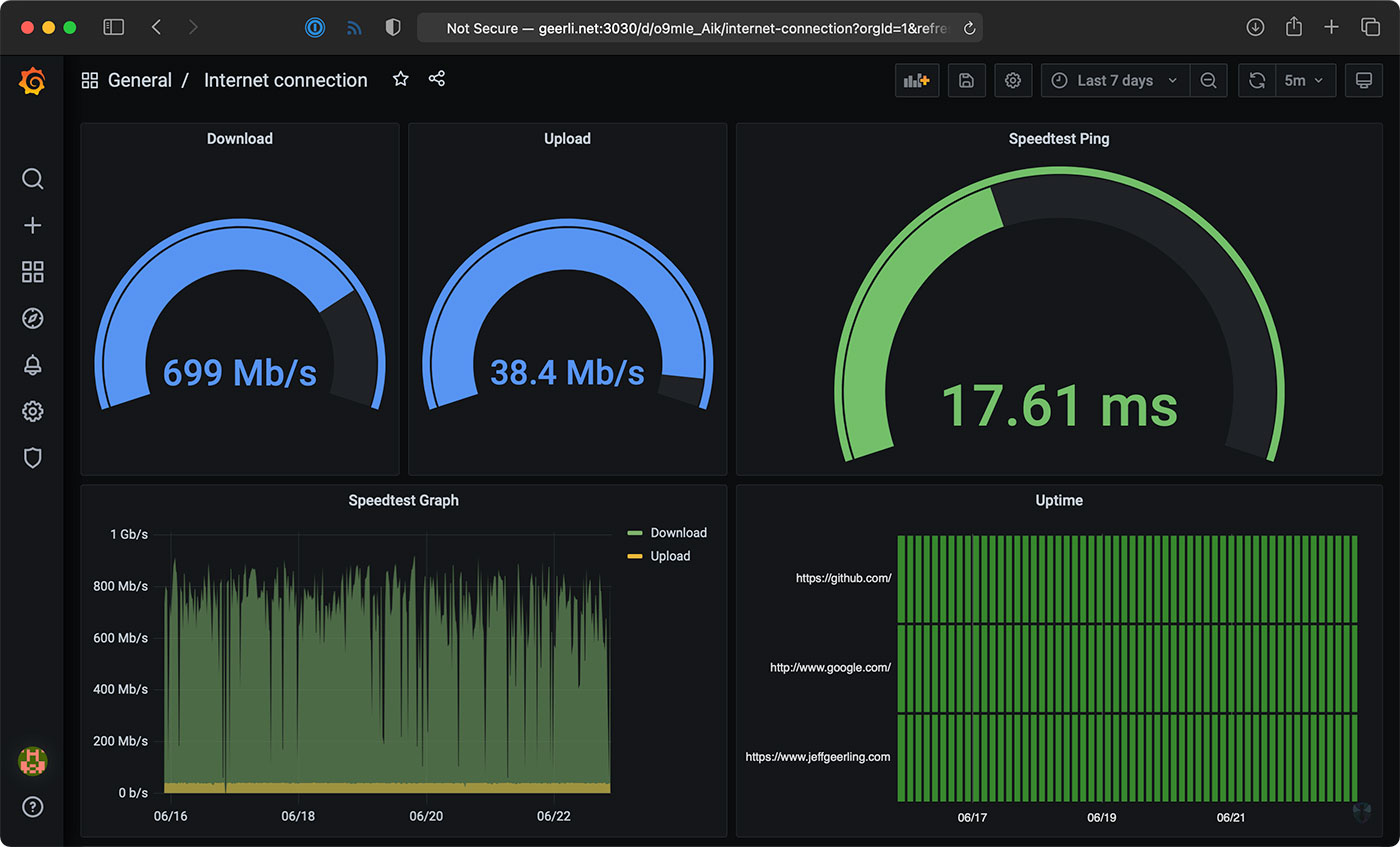
The Internet Pi runs Pi-hole for DNS privacy and ad-blocking, and Prometheus and Grafana to provide Internet connection monitoring dashboards.
Having a Pi monitoring my Internet continuously makes it easy to see trends over time, or confirm outages. If you just spot check by running a Speedtest every now and then, you don't have much data to go on.
Setting up Internet Pi
I built the free and open source internet-pi project on GitHub. It's simple to set up, and you can choose which parts of the platform you want to use.
I set up my Internet Pi from another computer, but you could also run the Internet Pi playbook on the Pi itself. Following the install instructions, you need to have a Pi set up with Raspberry Pi OS running on your network, and be able to SSH into the Pi.
Here are the steps to get it going:
- Make sure you have Ansible installed:
- (If
pip3is not installed)sudo apt-get install -y python3-pip pip3 install ansible
- (If
- Download the internet-pi repository to your computer:
git clone https://github.com/geerlingguy/internet-pi.git && cd internet-pi - Install the Ansible Galaxy content that's required to make the playbook work:
ansible-galaxy install -r requirements.yml - Make copies of the
example.inventory.iniandexample.config.ymlfiles (dropping theexample.from the filenames) and modify them for your own needs - Run the playbook:
ansible-playbook main.yml
The playbook installs all the tools you choose in your configuration file, and once that's done, you should be able to access your Pi's IP address in a web browser to see Pi-hole, or visit the IP address with the port :3030 on the end to see the Grafana dashboards.
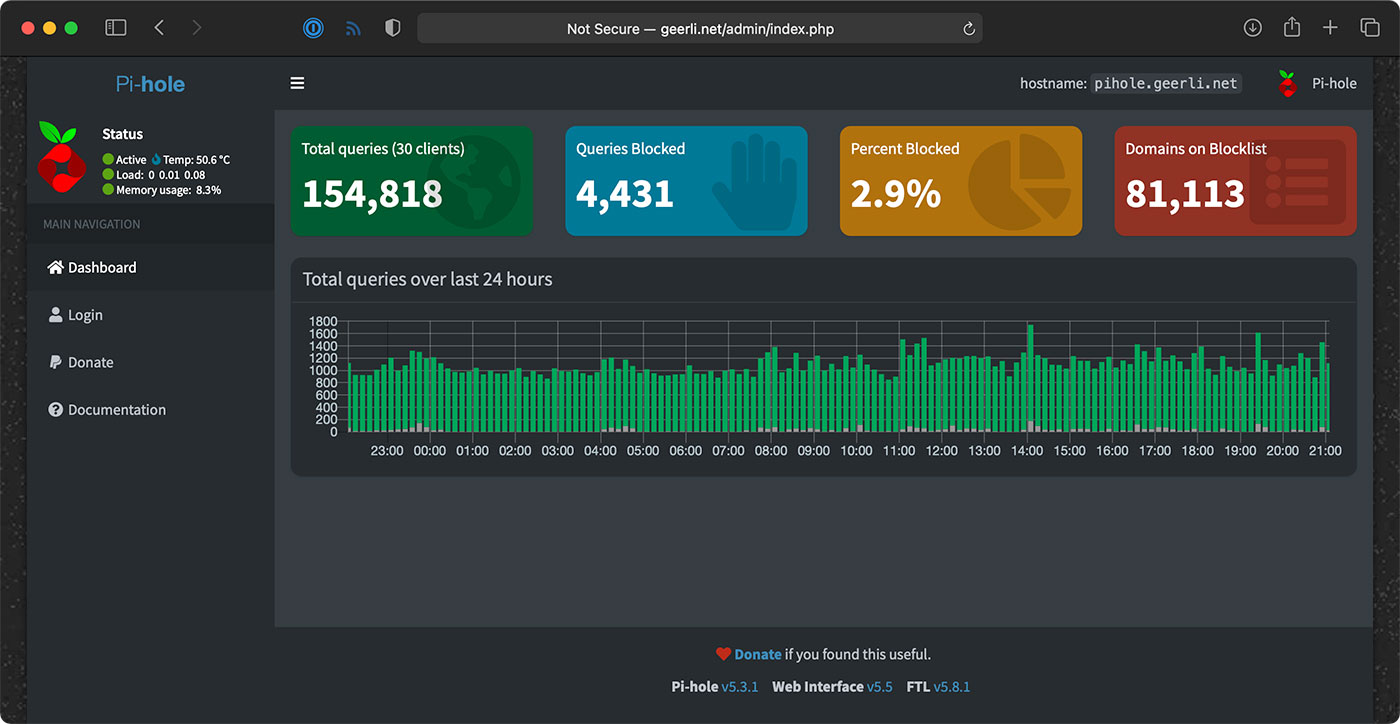
Setting up Pi-hole
If you wanna use Pi-hole as your home network's DNS server, you should configure your router to advertise the Pi's IP address as the primary DNS server for your whole home network. For extra redundancy, you could actually configure two Pis running Pi-hole, but that's a topic for another post!
But the great thing is, that allows you to see all the DNS requests your devices are making, and make sure (for the most part) things like so-called 'smart' TVs don't send tons of information to advertisers.
Pi-hole is a great first line of defense for your Internet privacy, at least at home, and it even has some other neat tools like a simple DNS server, if you want to use them.
Internet monitoring
The Internet monitoring dashboard is automatically configured for you, but it can take up to an hour before you start seeing data.
In my case, it's been running for a couple months, so I can see the Internet connection for the past day, week, or even longer!
The monitoring configuration runs one container that connects to Speedtest.net. Every 30 minutes or so, another container running Prometheus tells the first container to run a speed test.
NOTE: If you run this monitoring on your own network, be aware that these Speedtest.net checks will consume a good amount of data, especially if you run them more frequently. If you have data caps and want to use this monitoring solution, make sure to modify the check interval so you don't get an unexpected overage. ISPs, gotta love 'em!
It stores that data on the Pi, and the Grafana dashboard displays it over time. There's another service that does simple checks on websites you can configure for uptime and HTTP request timing stats—those lightweight checks are performed every few seconds, to give a detailed view when there is more latency in your Internet connection.
One thing I found interesting was my Cable internet connection—which is supposed to be one 930 Mbps—is only really about 700 Mbps on average.
Upload speeds are more consistent, so I begrudgingly pay for this high-tier plan... But I'd be a lot happier with 50 or 100 Mbps of asymmetric data, since I'm not downloading terabytes of files every day.
Starlink monitoring
The main reason I set this stuff up was to compare my Gigabit Cable Internet to SpaceX's Starlink Internet.
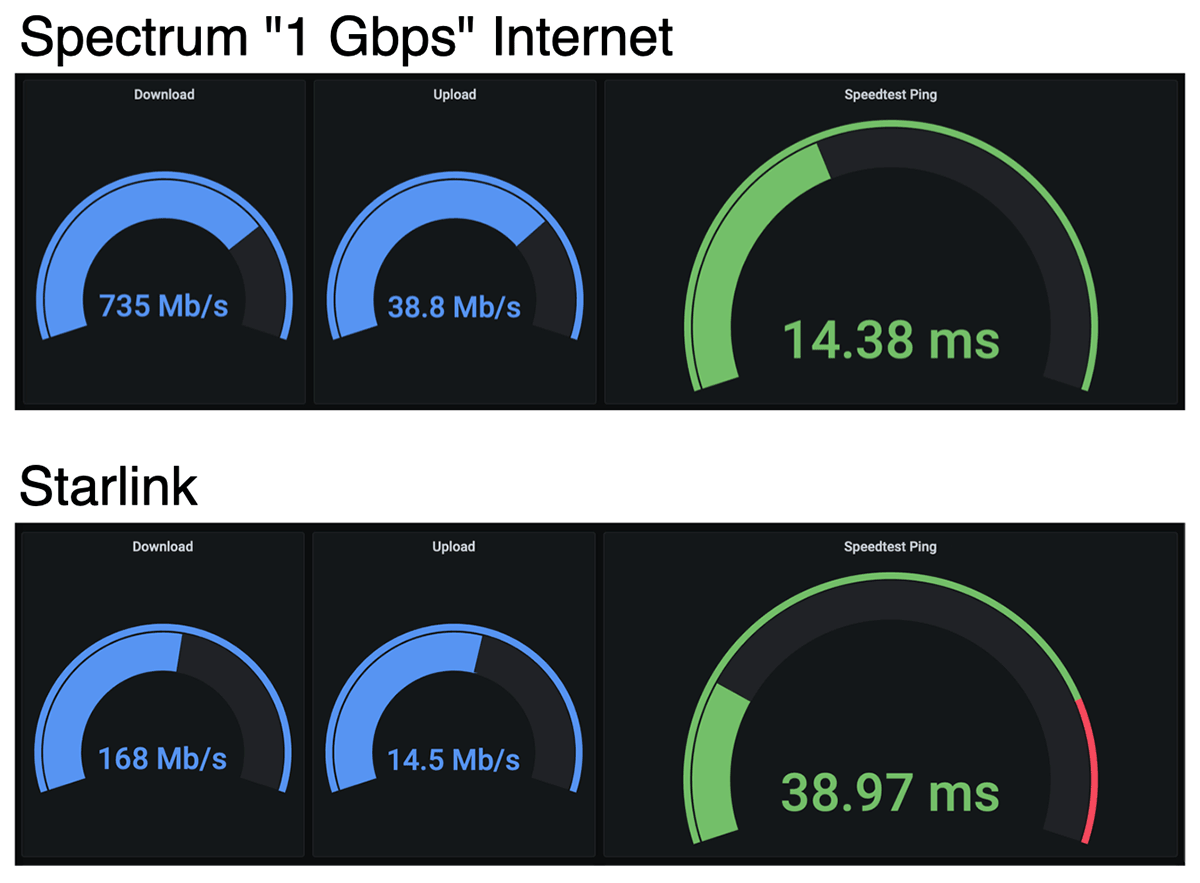
I'll get more into Starlink in a future review, but it looks like on average, when it has a stable connection, I get over 150 Mbps down, and 15 Mbps up, with 40 milliseconds of latency.
Those numbers are less than my Cable ISP; but Starlink also costs less—it's $99/month. And Starlink is also beaming the Internet through satellites up in the sky! For someone who doesn't have a fast Cable option (like rural customers), that's a mind-blowing upgrade from dial-up speeds.
But I mentioned earlier, there's also a Starlink-specific dashboard that gives all the details you'd normally find in the Starlink App.
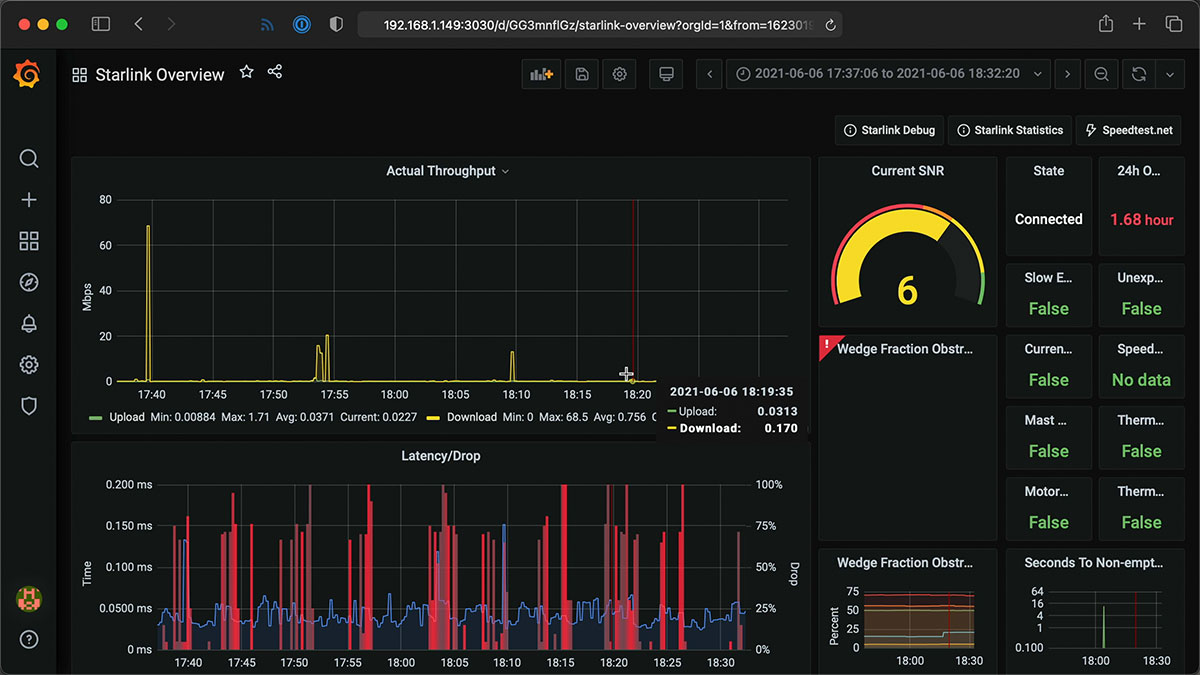
I haven't been actively using the Starlink connection today, so it's a little barren, but it gives a ton of detail, and I'd like to thank Daniel Willcocks (DanOpsTech) for making this possible; I'm using his Docker image and dashboard, and he even adjusted it to work on the Raspberry Pi after I asked about it!
Power monitoring
I also monitor Starlink's power consumption using a Shelly Plug US and a custom Shelly Plug Prometheus exporter I wrote:
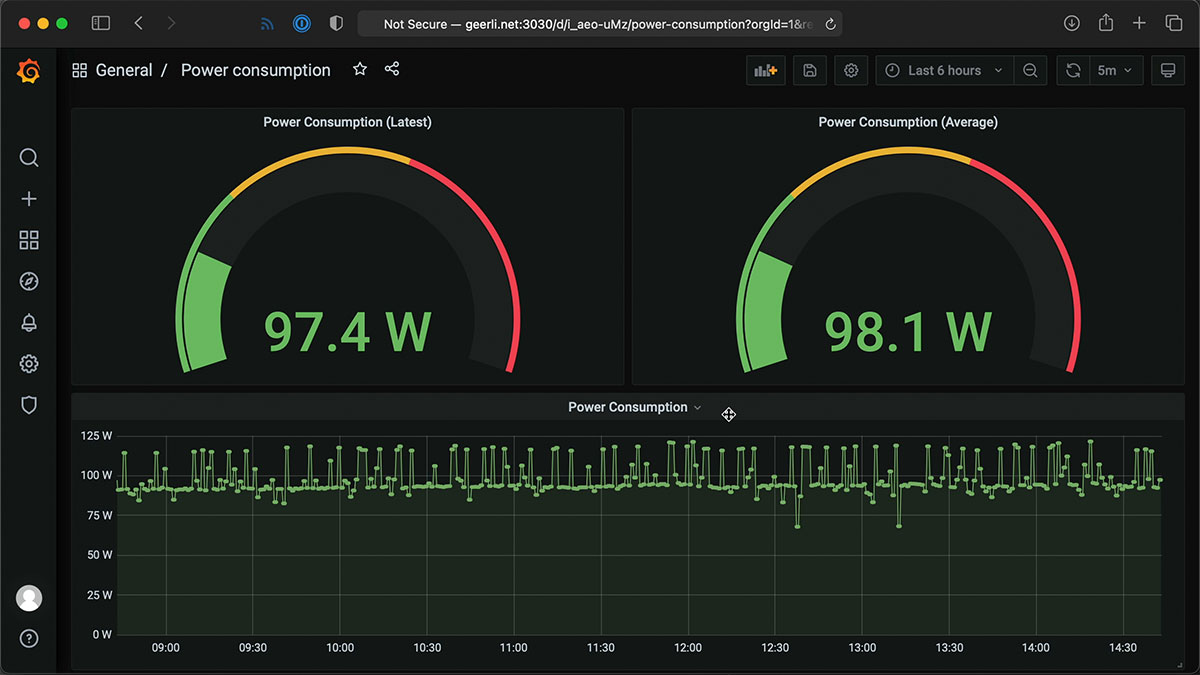
Starlink's dish and router use a lot of power (more than you might expect)—but I'll discuss more about that in my Starlink review coming soon! I have a blog post with more about how I set up the Shelly Plug power monitoring.
Conclusion
Now I know exactly how much my ISP is fleecing me for Internet. In Spectrum's case, it looks like they're only giving me about 3/4ths of what I pay for.
I wish I could just pay them $110 a month instead of $150, but if I did that, they'd cancel my service!
I'd like to thank Max Andersen for the original inspiration for the original monitoring configuration, the developers behind Pi-hole for making it free and open source, and especially Miguel who maintains the speedtest exporter, for his help getting some bugs fixed!
Comments
Hi Jeff, how to I set a PI up just for monitoring, I'd like to monitor my Lightwave RF Sockets, Switches and possibly my Netatmo Weather Station, but I wouldn't want PI Hole installed?
Sorry I'm a newbie when it comes to PI
Thank you, Jeff! Great Project!
Any idea when the bug might get fixed? [https://github.com/geerlingguy/internet-pi/issues/192 ]
Thanks, again!
Using a Pi 4 - Internet Monitoring only. It's been working perfectly on a network 192.168.4.xx. Moved it to a different network 192.168.50.xx. Able to connect to it with 192.168.50.xx OK. Problem no internet connection.
Just shutdown at original location and powered up at new one. No other changes.
Any suggestions.
Thanks so much for your project, this is just what I was looking for to make my case against Frontier. Possibly the worst ISP on Earth!
I do have a couple questions if you have time.
How do I get Grafana or Prometheus to change data to the web sites and speedtest interval I have now changed to? It shows old and new versions of websites. I've tried rebooting and restarting ansible-playbook.
Which files are the correct ones for data vs backup, example.inventory.ini and example.config.yml or the ones with example dropped? I saw errors when I removed example and the opposite file also caused an error. So I left both versions intact and are exact copies, I then saw both config files loaded and no errors. My guess was the example file was the backup and not used, was this wrong? But it also loaded.
Lastly, how best to get my data out and into Excel? Is it save to the pi? I do see the export options in Grafana.
Thanks for the gift, this is going to be such a help.
Michael
Hi,
very nice project I was trying to instal this on Raspberry PI Zero-W with an ArchLinux Distro and when I want to start it i get the following error:
TASK [Run Docker install convenience script.]
fatal: [127.0.0.1]: FAILED! => {"changed": true, "cmd": ["/tmp/get-docker.sh"], "delta": "0:00:00.261560", "end": "2021-10-07 12:25:19.067168", "msg": "non-zero return code", "rc": 1, "start": "2021-10-07 12:25:18.805608", "stderr": "", "stderr_lines": [], "stdout": "# Executing docker install script, commit: 93d2499759296ac1f9c510605fef85052a2c32be\n\nERROR: Unsupported distribution 'archarm'", "stdout_lines": ["# Executing docker install script, commit: 93d2499759296ac1f9c510605fef85052a2c32be", "", "ERROR: Unsupported distribution 'archarm'"]}
Is this fixable or is the SW not designed for my setup?
Thanks
John
Is there a guide to installing this latest version using docker compose, I personally use Portainer but should be very similar.
I've been wanting a monitoring tool like this for a while and found this post. I just set it up. It worked nearly flawlessly (error when running main.yml fixed after reboot/retry).
Thank you for putting this together!
Just a couple of questions.
Would this install work the dietpi distro?
How to do recursive DNS with pihole and the docker setup here? And how to change the pihole password if you're a dumbass like me and missed the config file edit, again I'm assuming because of the docker setup. If you can't tell I'm not familiar with docker but am learning. Slowly. :)
Hi Jeff i managed to get it started thank you. I have one concern when i logged into my Pi i checked network connetions in the top corner and found 7 different connections in ther pop up when you hover over the arrows. my Pi os was a fresh clean install on a new memory card. I was wondering if you know what these connections were to and why they are there they only showed up afrer installing all this. sorry if its a simple answer im a newb to all this i have a picture of the connections but not sure how to add it to this thread.
Many thanks
Wez
I found this after watching your excellent YouTube on StarLink. But after installing I get no default dashboard for the speedtest. PiHole works but no default on ip:3030
What can I look at sir?
Ha, it was my user error. I just had to dig for it bit. Works great, thank you.
How do you clear/reset the collected data for internet-connection? I was monitoring one ISP and went to another. I don't want the data from the first ISP to dirty the other one. I'm new to dockers, grafana, and prometheus, so a little patience and guidance is appreciated.
BTW, using Raspi 3B+. Thanks.
THIS is why folks don't like Linux et.al. I have run in to so many errors. I wonder if the author actually did the steps they suggested and nothing more. I am going to reinitialize my pi and document the nightmare. I have Python3.9.5 now installed but something called pip fails.
Can't even get past step 3:
pi@raspberrypi:~/internet-pi $ ansible-galaxy install -r requirements.yml
Traceback (most recent call last):
File "/home/pi/.local/bin/ansible-galaxy", line 34, in
from ansible import context
ModuleNotFoundError: No module named 'ansible'
Trying to locate it I get:
pi@raspberrypi:/ $ find . -name "ansible" 2>/dev/null
./home/pi/.local/lib/python3.7/site-packages/ansible_collections/netbox/netbox/docs/js/ansible
./home/pi/.local/lib/python3.7/site-packages/ansible_collections/ansible
./home/pi/.local/lib/python3.7/site-packages/ansible
./home/pi/.local/lib/python3.7/site-packages/ansible_test/_data/injector/ansible
./home/pi/.local/bin/ansible
Why didn't it install on the $PATH? I even rebooted and still no joy.
I also get exaclty the same issue - ansible-galaxy not found.
$ git clone https://github.com/geerlingguy/internet-pi.git && cd internet-pi
Cloning into 'internet-pi'...
remote: Enumerating objects: 416, done.
remote: Counting objects: 100% (163/163), done.
remote: Compressing objects: 100% (60/60), done.
remote: Total 416 (delta 127), reused 118 (delta 103), pack-reused 253
Receiving objects: 100% (416/416), 245.84 KiB | 1.35 MiB/s, done.
Resolving deltas: 100% (254/254), done.
pi@piCM4:~/internet-pi $ ansible-galaxy install -r requirements.yml
-bash: ansible-galaxy: command not found
Everything seems to have installed just fine on the CM4, 8/32 GB device.
What am I missing?
This set of commands work on what version of raspbian, or other compatible OS?
pihole just had an update. How do we get about updating the pihole component? Doing pihole -up in docker results to an error.
```
pi at raspberrypi:~/internet-pi $ docker exec -it pihole /bin/bash
root at pihole:/# pihole -v
Pi-hole version is v5.5 (Latest: v5.6)
AdminLTE version is v5.7 (Latest: v5.8)
FTL version is v5.10.2 (Latest: v5.11)
root at pihole:/# pihole -up
Function not supported in Docker images
root at pihole:/#
```
so i am not too versed with linux and i pretty much know how to copy paste commands into the terminal so be easy on me
i tried to update the pihole version with pihole -up and the command ran but just said that i am up to date (although in the interface it didnt update and still says there's an update available) also tried to run ansible-playbook main.yml which basically did nothing
would really like some help updating the pihole
For upgrading, please see the guide in the README: https://github.com/geerlingguy/internet-pi#updating
Thanks for this. I know I have read it somewhere. This worked.
Morning,
i'm running raspberry os 64 bit. the task is getting hung up on installing docker compose using pip.
any idea's
I'm close, so close. It's running. But I cannot seem to change the interval that it runs a speed test of pings the 3 web sites. I change the intervals in 'internet-pi/config.yml', then rerun 'ansible-playbook main.yml --ask-pass', then reboot. But it continues to run the speed test and ping(s) same as before. What am I missing?
Can this be install on a running PiHole system? I would like to keep the PIHole out of the container.
Yes, you can just set the pihole_enabled variable to false before deploying it. It will just leave its Pi-hole install out of the mix.
I've got this set up and running but it seems that the data only goes back 15-16 days. I've tried to find a setting that lets me hold on to the data longer but I can't seem to figure it out. Any ideas where I should be looking?
Newer versions should have a setting that's currently specified as hardcoded in the docker-compose file for the prometheus instance: https://github.com/geerlingguy/internet-pi/blob/master/internet-monitoring/docker-compose.yml#L22.
After flashing a usb stick 4 ou 5 times, I finally managed to install this on a rpi4. The new version of raspberry os (bullseye) eliminated all of the problemas I had previoulsy.
Was following the instructions on a brand new "Raspberry Pi OS Lite" install (from the main raspberry pi site), surprisingly git didn't seem to be installed by default so I had to add that step in order to do the git clone, don't know if this is a recent update to their image but it might be worth adding to the instructions (here and on github)?
Im lost on the 4th step on setting this up on my pi. any help?
pi@raspberrypi:~/internet-pi $ ansible-playbook main.yml
[DEPRECATION WARNING]: Ansible will require Python 3.8 or newer on the
controller starting with Ansible 2.12. Current version: 3.7.3 (default, Jul 25
2020, 13:03:44) [GCC 8.3.0]. This feature will be removed from ansible-core in
version 2.12. Deprecation warnings can be disabled by setting
deprecation_warnings=False in ansible.cfg.
[WARNING]: Unable to parse /home/pi/internet-pi/inventory.ini as an inventory
source
[WARNING]: No inventory was parsed, only implicit localhost is available
[WARNING]: provided hosts list is empty, only localhost is available. Note that
the implicit localhost does not match 'all'
[WARNING]: Could not match supplied host pattern, ignoring: internet_pi
This is what im getting for the 5th step
im trying to do this on my pi locally
I got this same error when I was running Buster/Debian 10 on a Raspberry Pi 4 4GB.
I installed Bullseye Debian 11 and it worked correctly.
Also followed Jeff's Blog post to flash the Beta Test Bootloader so I could install Bullseye over the internet.
Anyone can help me with this error, tried now on 2 devices and not sure what im doing wrong. all installed ok but everytime i run playbook i get this error at the end.
fatal: [127.0.0.1]: FAILED! => {"changed": false, "msg": "Error connecting: Error while fetching server API version: ('Connection aborted.', PermissionError(13, 'Permission denied'))"}
On Github page of this project you have this comment:
If running locally on the Pi: You may encounter an error like "Error while fetching server API version". If you do, please either reboot or log out and log back in, then run the playbook again.
so try rebooting the pi and try again. It worked for me.
Is there a way to replace pi-hole with AdGuard and use your dashboard?
Hey there,
thank you for your work, great project!
I do however have one issue...
everything works great except the internet speeds and latency. If I go to the query inspector for download or upload speeds I get the following:
Object
request:Object
url:"api/datasources/proxy/3/api/v1/query_exemplars"
method:"POST"
data:Object
query:"speedtest_upload_bits_per_second{}"
start:"1636368445"
end:"1636973280"
hideFromInspector:false
response:Object
message:"404 page not found
"
error:"Not Found"
response:"404 page not found
"
which I think might be the problem?
Anyone has any ideas maybe? Unfortunately I am totally new to docker containers and prometheus...
I'm trying to get this working on my raspberry pi, I have counted this error;
fatal: [192.168.1.4]: FAILED! => {"msg": "The task includes an option with an undefined variable. The error was: 'ansible_user' is undefined\n\nThe error appears to be in '/home/pi/internet-pi/tasks/docker.yml': line 58, column 3, but may\nbe elsewhere in the file depending on the exact syntax problem.\n\nThe offending line appears to be:\n\n\n- name: Ensure {{ ansible_user }} user is added to the docker group.\n ^ here\nWe could be wrong, but this one looks like it might be an issue with\nmissing quotes. Always quote template expression brackets when they\nstart a value. For instance:\n\n with_items:\n - {{ foo }}\n\nShould be written as:\n\n with_items:\n - \"{{ foo }}\"\n"}
Just wanted to say this install was done very well. I had the logoff/logon issue but everything appears to be working after that.
I did have a question though. Where does Grafana pick up the data from. I am not too Docker savvy and didn't see a definition for the logs (which I assume are json). Thanks!
Hey Jeff and all,
I was able to install everything and have everything running smoothly until I start digging and play around a little bit.
if you run:
```
cat tasks/internet-monitoring.yml or
cat tasks/pi-hole.yml
```
You can clearly see that something needs to be written in the home folder, example:
- name: Create Pi-hole folder on Pi.
```
ansible.builtin.file:
path: "{{ config_dir }}/pi-hole"
state: directory
mode: 0755
become: false
```
Unfortunately nothing gets written for pi-hole and I suspect also fro Grafana and I can't figure out why everything is working nevertheless.
if I check sudo docker container ls:
```
f616cddee2e4 pihole/pihole:latest "/s6-init" 14 hours ago Up 13 hours (healthy)
```
I am wondering if the problem might be related to the fact I don't have a user `pi` in my machine....
Hi there,
As far as I can tell i have successfully completed the install however on the Internet speed dashboard there appears to be no data (completed install yesterday so should be something right?). And by no data I mean there are no dials or anything, the page keeps suggesting me to add/create a dashboard otherwise it is empty?
Should i try re-installing?
Jeff, First off thank you for taking the time to put together such a good video/blog post. I've setup my Internet Pi without Pi Hole, and everything is showing data correctly, however I am still getting a modal that says "Annotation Query Failed - Cannot read properties of undefined (reading 'to')" Any ideas what might be causing that, or how I can get rid of that error? Thank you!
Have you thought of adding this to Home-Assistant? I'm new to HA, and would like to add something like this, but not sure how.
I installed this and the pihole side is working perfectly but when I go to my.ip.add.ress:3030 it comes back saying connection refused. Anyone else experience this?
I get a "Service Unavailable" error on each graph. I haven't looked in a week or so and don't know when this began.
Any chance of adding this to home assistant? The SpeedTest add-on is lacking and not very accurate
Well my friend, for me as well the SpeedTest add-on is very unaccurate.
I have a connection which is supposed to be 300Mbps DN and 128Mbps UP.
The SpeedTest add-on is showing me 77.2Mbps DN and 94Mbps UP.
If I'm running Ookla SpeedTest on my PC, anytime, I'm getting something around 280Mbps DN and 140MbpsUP.
I really wanted some tool to show me a good image of y internet connection.
What model Pi are you using? When I first saw Jeff's video, I set this up on a Pi that I had lying around. I have 400 Mbps down by 20 Mbps up service from Spectrum and I was seeing around 80 Mbps down and around 22 Mbps up. The problem was I was using a Pi 3B, which only has a Fast Ethernet (i.e. 100 Mbps Ethernet). I bought a Pi 4B and when I setup Internet Pi on it, I was seeing something like 380 Mbps down and 22 Mbps up. So, check to see what model Pi you are running. That may likely be the reason why your bandwidth is so low.
When running the playback I receive this
"
ERROR! no action detected in task. This often indicates a misspelled module name, or incorrect module path.
The error appears to have been in '/home/pi/internet-pi/main.yml' : line 26, column 7, but may be elsewhere in the file depending on the exact syntax problem.
The offending line appears to be:
handlers:
-name: Include handlers
^here
"
Most likely you have an older version of Ansible installed. You need to install a later version e.g. via Pip.
Unfortunately, this doesn't work at all. The blocklist tab is missing form the Settings page in Pihole and there's no internet monitoring dashboard configured automatically.
Trying to update and getting the following when going through the instructions:
using command: ~/pi-hole $ docker-compose up -d --no-deps
Removing pihole
Recreating addcab8b73aa_pihole ...
Recreating addcab8b73aa_pihole ... error
ERROR: for addcab8b73aa_pihole Cannot start service pihole: driver failed programming external connectivity on endpoint pihole (852377e6f0b24472fb75039ba9caf99fd3212f3beee3355c7801e3676abbd6ba): Error starting userland proxy: listen tcp4 0.0.0.0:80: bind: address already in use
ERROR: for pihole Cannot start service pihole: driver failed programming external connectivity on endpoint pihole (852377e6f0b24472fb75039ba9caf99fd3212f3beee3355c7801e3676abbd6ba): Error starting userland proxy: listen tcp4 0.0.0.0:80: bind: address already in use
ERROR: Encountered errors while bringing up the project.
Reboot and same issue.
Any suggestions ?
Has anyone else noticed that their Pi network traffic has gone up (more than I would have thought)? I followed the steps outlined by Jeff and have reinstalled everything a couple times but my Pi now shows 4.5 gig worth of traffic in my Unifi Controller over 12 hours. I like the utility this option brings but not at the expense of the bandwidth.
Maybe its just my setup, Ill play around with the configurations and see if it gets better but was wondering if anyone else noticed this.
If I want to use only the internet monitoring tools, not pi hole, is there anything I need to take into consideration during the install? Or can I just follow steps 1 through 5 and choose not to use pi hole when running the playbook?
In the config file, you just need to disable (set to false) the pi hole stuff.
I did this to get a fully separate docker container:
sudo pip3 install docker-compose
git clone https://github.com/geerlingguy/internet-monitoring
cd internet-monitoring
sudo docker-compose up -d
Will this startup automatically upon startup?
lets say a power outage, when the power comes back on, will it start up?
Or will we have to go in and run the ansible command?
Yes, it's set to always restart after reboot by default (that's managed by Docker and the docker-compose files this playbook sets up).
Hey. I've been following your guide to install this internet monitor and I've come up with this error when I run ansible-galaxy install -r requirements.yml
ERROR! The requirements file '/home/pi/requirements.yml' does not exist.
I cann't find anything in the comments here to help so I thought I'll ask.
I look forward to hearing from you, or someone else if anyone has come across this.
Internet Monitor - Grafana is giving me a 503 error on all modules. I've updated following instructions which seemed to run successfully, but still getting the same error. This was working fine, I had not touched it for a week and when I opened Grafana, I just get this error on each module.
I'm also running in to this problem and I also followed the update guide.
I finally just did a format and reinstall from scratch and working fine for the last hour. But it ran for a couple months previously, so we shall see.
Hello Jeff, please help, I cannot log into pi-hole despite using the password inside config.yml. I changed it multiple times and rebooted my PI after each one. Can you tell me what I'm doing wrong?
Hi Jeff. I really love your YouTube videos. The first one I watched was the one where you were evaluating Starlink which, of course, led me to your Internet Pi project. I've set it up on several Pis now and love to use it to make sure I'm getting what I should be getting. I was wondering, though, is there a way to setup alerting if bandwidth goes below a certain threshold for multiple tests? Ansible, Docker, Prometheus, and Grafana are really new to me. In fact, this is the first time I've played with them. Linux, I am very comfortable with as I work with it on a daily basis and have been working with UNIX since the early '80s and Linux since the early '90s.
Thank you!
Hi all,
Got it this running on a Pi4B (4GB) and all seems ok, apart from the Speedtest values.
Is there any way to check where the results are as I am just showing 0b/s and 0ms?
Can the Speedtest be run manually to see if it is working?
Thanks for a great project!
is there a way to just install the Prometheus/internet speed test part to this as i all ready have influxdb, graphana, and node red running on my Pi?
I'm curious how you are doing the ping test. I have a few public sites in my test list and they all work perfectly. However, when I try to add any of my local IP addresses they fail. If I SSH into the Pi and ping those same IP addresses they respond successfully.
An example of one of these entries is
- http://192.168.1.1;Router;local;internetbox
I've also tried without the protocol on the first field, with the IP address in the 2nd field, external instead of local in the 3rd field and a different name in the 4th field, but I haven't found a combination that works for local pings
Ansible newby here.
Got everything installed / downloaded to the point of
"Make copies of the example.inventory.ini and example.config.yml files (dropping the example. from the filenames) and modify them for your own needs."
1. I've commented out the the 10.0.100.52 line and uncommented the 127.0.0.1 line. If I do more with ansible than just the internet monitoring, do I need to change the 10.0.100.52 line to the IP address of the monitoring pi and comment out the 127.0.0.1 line?
2. For the config.yml file
a. If this is the first time I've done anything with the config.yml file and haven't set up pihole, should I set up pihole_enable to "false"?
b. I'm looking through the main.yml file. In the pre-tasks area, why are both example.config.yml and config.yml referenced?
This is great, just installed at a remote site for monitoring the 4G internet connection. If I increase the time between speedtests to conserve data to say every two hours in the config file, do I need to run the playbook: ansible-playbook main.yml again to update or will it just pickup the change?
You will need to run the playbook again, so the change is applied.
Hi, I would like to uninstall the repository. I am getting: Package 'grafana' is not installed, so not removed
Thank you .
Hi.
How to I update the Pihole?
This is working great for some time, and now when I try to update the Pihole with " pihole -up" its not letting me.
I also tried to update it from inside the docker "docker exec -it pihole bash", nothing works. Please let me know how can I do that.
Thanks.
I was able to get the Internet monitor up and running and works good. However, Prometheus only saves data for the default 15 days. I would like to extend that for better trend analysis. I found the Prometheus setting storage.tsdb.retention.time that overides this flag if set to anything other than default. I cannot find where to change the setting. Have looked all over Graphana and Pometheus UIs, but no luck. Any assist appreciated.
Hi - I also had this question! I think the way to do this is add an additional command in the internet-monitoring/docker-compose.yml file, so it would look something like this:
command:
- '--config.file=/etc/prometheus/prometheus.yml'
- '--storage.tsdb.path=/prometheus'
- '--storage.tsdb.retention.time=365d'
- '--web.console.libraries=/usr/share/prometheus/console_libraries'
- '--web.console.templates=/usr/share/prometheus/consoles'
Hello, thanks for all the work! I was able to install and run this on a Pi 4, very slick, still learning, new to docker.
How can I set the time delay for the speedtest? as far as I can tell is running back to back, for about 8GB a day of traffic.
Once an hour or 3 would be fine with me. Interesting, my internet is 500mb down, I get that on my linux pc, but only 300 on the pi 4.
Also on pihole, why can you not ssh into the docker instance and run pihole -up upgrade internally? (again new to docker)
Thanks again,
I set up monitoring on my Pi 4 per the instructions above and have had it running for the last couple of weeks.
I'm seeing 939 Mb/s fairly consistently.
However, when I run speedtest from the shell on the same machine (via SSH) I'm seeing a regular 460 Mb/s.
Why would I be seeing such a difference in speed levels?
A SUPER channel Jeff thank you for your dedication these projects are top shelf.
I am pretty new to the Rpi so i am still learning every day. I managed to setup a PiHole and then implemented this onto several other networks I managed with a combination of Pi4's and Pi3B+'s.
This is my experience…. (FYI I have 30yrs of computing experience including a bit of linux but not a lot so I understand the challenges)
1. Don’t expect the Pi to hold your data and settings forever. Learn how to reinstall at the drop of a hat (POE Hat… haha) you are playing is an experimental cheap device and treat it as such
2. Document the process
3. Enjoy the process… the Pi is fascinating, powerful, and yet a limiting gateway in making with linux
These instructions I found to work well for anyone who wants to install the monitoring on a Pi that is 3B+ or 4 and just wants to run the monitoring by itself OR already has PiHole installed. This is NOT for anyone that wants to install PiHole as well in a docker at the same time.
You will want to make sure you can SSH into your Pi. If you DO NOT know how to do this – do your own research on how to do this. I am also doing this setup from a windows machine.
Also, I would suggest the current 64bit built of PiOS Lite… again do your own research on this. If you currently have a 32bit build – blast that sucker away and upgrade to the 64bit RIGHT NOW and then come back to this.
==== THIS IS THE DEEP DIVE ======
(NOTE: The IPADDRESS is the just that… the IP Address of the raspberry pi… don’t make me teach you about IP addresses)
Open a command prompt and ping the raspberry pi from windows it is:
ping IPADDRESS /t
You should see the IP ping request successful. Open another command prompt and SSH into your Pi. Now just follow the rabbit copy and paste the following commands into the Pi……. NOTE: don’t skip on the reboots these are important!
sudo apt-get update && sudo apt-get upgrade -y && sudo reboot
sudo apt-get install -y python3-pip && sudo apt install -y git && sudo pip3 install docker-compose && pip3 install ansible
sudo reboot
git clone https://github.com/geerlingguy/internet-pi.git && cd internet-pi && ansible-galaxy install -r requirements.yml
sudo reboot
(take a copy of the example files necessary to make things run and then edit them as per below)
cd internet-pi && cp example.inventory.ini inventory.ini && cp example.config.yml config.yml
vi inventory.ini (edit so local is the running script - ie # out the top IP address and unhash the bottom IP address)
vi config.yml (pihole = false rather than true... also down the bottom if you have a starlink connection, change from false to true)
ansible-playbook main.yml
(this will take some time wait for it...)
sudo reboot
cd internet-pi && ansible-playbook main.yml
(this will take some time wait for it...)
sudo reboot
(NOTE: The following can take a while to initially happen especially in a pi3B+)
http://192.168.IPADDRESS:3030/login
admin // admin
(change password when prompted)
Go to dashboards, browse, and click on Internet Monitor AND/OR Starlink
Top to the left of "Internet connection" (the word no where else) OR "Starlink Overview", click on the Star to make it a favourite
Add this to your links in your browser so you can go straight to it
Go to settings preferences and change timezone to browser time and default dashboard
Go to admin preferences and change timezone to browser time and default dashboard
ENJOY!
Tech Guy Craig
I have followed the same steps as you mentioned but getting the following error
cd internet-pi && ansible-playbook main.yml
[WARNING]: Unable to parse /home/pi/internet-pi/inventory.ini as an inventory
source
[WARNING]: No inventory was parsed, only implicit localhost is available
[WARNING]: provided hosts list is empty, only localhost is available. Note that
the implicit localhost does not match 'all'
[WARNING]: Could not match supplied host pattern, ignoring: internet_pi
PLAY [internet_pi] **
skipping: no hosts matched
PLAY RECAP **
Is is possible to monitor a wireless interface (starlink) and use the Ethernet for the web interface?
Is Unbound DNS compatible?
Hi, i'd let like inquire if there's a way to block this on my internet as i recently found someone installed it on my internet whilst i was setting up a password. I find it very concerning that someone who i don't know is tracking my web searches as i'm in my late 20's.
Setting up on a PI4 using Ubuntu LTS 20.X
main.yml runs until:
TASK [Ensure Pi-hole is running.] **********************************************
fatal: [127.0.0.1]: FAILED! => {"changed": false, "errors": [], "module_stderr": "Creating pihole ... \nHost is already in use by another container\nCreating pi hole ... error\n", "module_stdout": "latest: Pulling from pihole/pihole\nDigest: sha256:60a9127372b0f7bb4b5eb09bc95e2735eb7b237999acf4bb079eb14b0f14632e\nStatus : Downloaded newer image for pihole/pihole:latest\n", "msg": "Error starting pro ject Encountered errors while bringing up the project."}
RUNNING HANDLER [Restart pi-hole] **********************************************
PLAY RECAP *********************************************************************
127.0.0.1 : ok=14 changed=3 unreachable=0 failed=1 s kipped=8 rescued=0 ignored=0
When I try to run main.yml using sudo
I get
ERROR! this task 'ansible.builtin.import_tasks' has extra params, which is only allowed in the following modules: include_vars, include_tasks, import_role, shell, meta, raw, win_shell, include_role, command, group_by, include, set_fact, add_host, win_command, script, import_tasks
The error appears to be in '/home/ubuntu/internet-pi/main.yml': line 26, column 7, but may
be elsewhere in the file depending on the exact syntax problem.
The offending line appears to be:
handlers:
- name: Include handlers.
^ here
Grafana web interface is active but PIHOLE is not.
What do I need to do to fix?
Jeff, thanks for creating this application. I have a (hopefully) quick question. If I have both the wired (eth0) and wireless connection active on my Raspberry Pi 4B, how do I direct the application to monitor just one interface or the other?
Thanks.
That's a bit difficult; you can set interface routing priorities in Linux (I have other blog posts that go into how to do that), but applications like Prometheus don't usually have a way to pin individually to one interface over another.
I'm now seeing this error: bad_data: exceeded maximum resolution of 11,000 points per timeseries. I searched and this is a Prometheus issue. So is that from the config.yml setting for ping interval? I left those at default of 60m and 5s.
Opps needed a reboot. File found.
Hi Just followed your instructions and I got 60% working. Basically I don't see the pretty graphs in the speedtest Download, upload and ping. All I get is lines of text saying "speedtest_download_bits_per_secon...." .
Any thoughts?
when i run the command 'ansible-playbook main.yml'
it does some stuff and then returns this
TASK [Ensure internet-monitoring environment is running.] *********************************************************
fatal: [127.0.0.1]: FAILED! => {"changed": false, "msg": "Error connecting: Error while fetching server API versionConnection aborted.', PermissionError(13, 'Permission denied'))"}
how can this be fixed?
Great post. question to Pi hole users, is it possible to send the real time query log to remote destination like syslog server or splunk, so we can perform some data analysis? TIA!
to those having a ton of issues getting script to work..
go to /home/USERNAME/internet-pi
no have folder? try using steps in the guide and one will be made.
open the example.config.yml file in Geany
line 7 # Pi-hole configuration. set pihole_hostname: USERNAMEHERE
line 9 set password
same for line 12 and 13
save it
copy to desktop
rename example.config.yml to config.yml
drag copy from desktop back in
double check that toy have
example.config.yml AND config.yml
Open example.inventory.ini in Geany
line 2 add a #
this means it will say #NUMEBRS ansible_user=USERNAME
notice that a # was added.
line 4 delete the #
notice that line 5 tells to to do just this
save file
copy to desktop
rename copy on desktop from example.
line 2 put your pi username that you log in with
line 4
open
copy to desktop
rename copy on desktop from example.inventory.ini
to inventory.ini
drag inventory.ini into internet-pi folder
MAKE SURE folder has example.inventory.ini and inventory.ini
MAKE SURE internet-pi folder has following
example.inventory.ini
inventory.ini
example.config.yml
config.yml
MAKE SURE you installed ansible onto pi
okay deep breath..
start this guide over.
now the script will find all files needed.
is it possible to us a different speedtest server like https://speed.cloudflare.com/ ?
Don't mean to spam, can delete the others,
got father, what seems almost to the end this time. Internet Monitoring environment fails. Seems to be a permission issue?
TASK [Ensure internet-monitoring environment is running.]
fatal: [127.0.0.1]: FAILED! => {"changed": false, "msg": "Error connecting: Error while fetching server API version: ('Connection aborted.', PermissionError(13, 'Permission denied'))"}
RUNNING HANDLER [Restart internet-monitoring]
PLAY RECAP
127.0.0.1 : ok=17 changed=10 unreachable=0 failed=1 skipped=2 rescued=0 ignored=0