Internet Service Providers are almost universally despised. They've pushed for the FCC to continue defining 25 Mbps as "high use" broadband, and on top of that they overstate the quality of service they provide. A recently-released map of broadband availability in the US paints a pretty dire picture:

Here in St. Louis—where I guess I should count my lucky stars we have 'high use' broadband available—I have only two options: I can get 'gigabit' cable Internet from Spectrum, or 75 megabit DSL from AT&T.
That's it.
And you're probably thinking, "Gigabit Internet is great, stop complaining!"
But Spectrum's "gigabit" Internet is 930 megabits down—in ideal conditions—but only 40 megabits up. And that's the highest plan that costs about $150 a month!
Some would die for those speeds (see the map above), but much of the world is better off. And are you really getting the speeds you pay for? You probably don't know.
Well, I do, thanks to a $35 Raspberry Pi! And you don't even need a Pi, you could run the software I use on any computer. I just like having a dedicated computer to run all my Internet connection tools, so it's easy to backup or replace, and it doesn't get bogged down.
Video
I have a video that goes along with this blog post, and it's embedded below; skip past it if you prefer reading over viewing.
My Internet Pi
This is my "Internet Pi" (hostname geerli.net):
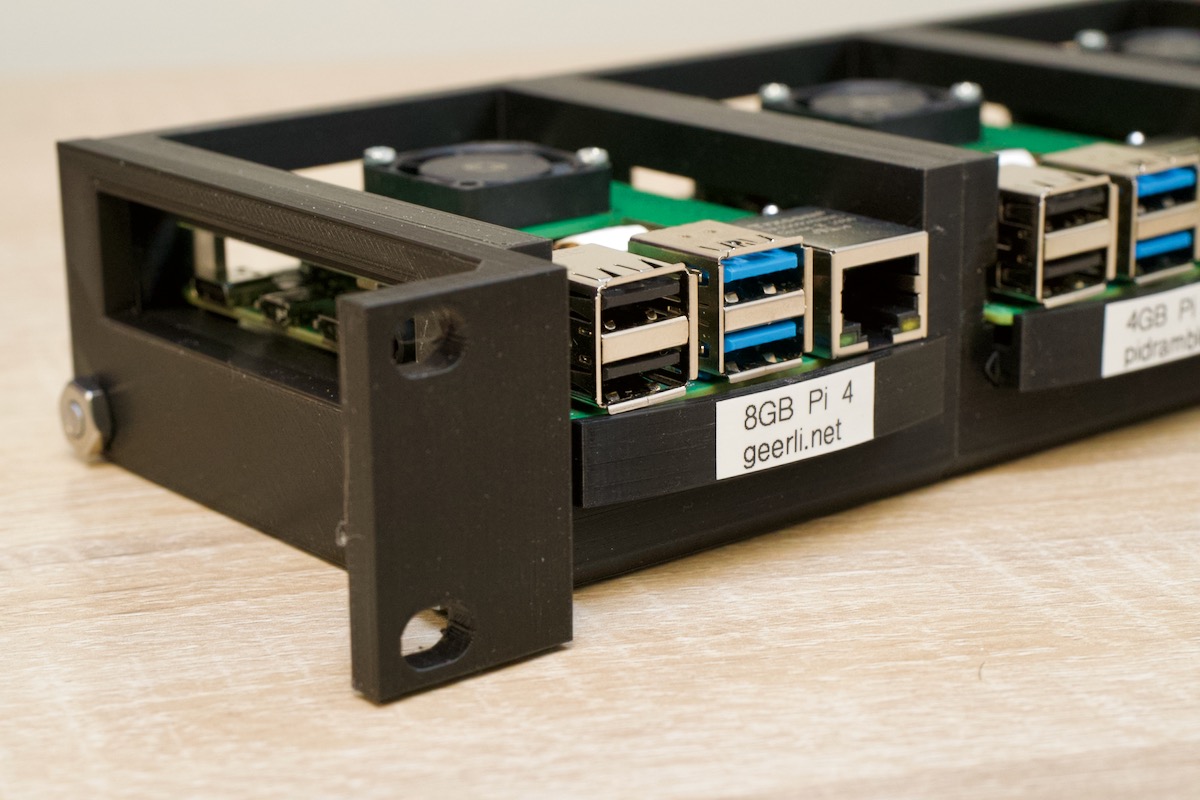
I have it installed in a rack (here's a video on the Pi rack), but it could just as easily be on my desk, or sitting by my Internet router.
The most important thing for measuring a network connection is that it's wired. WiFi, especially on the Pi, fluctuates quite a bit and is terrible for monitoring anything besides maybe WiFi signal strength.
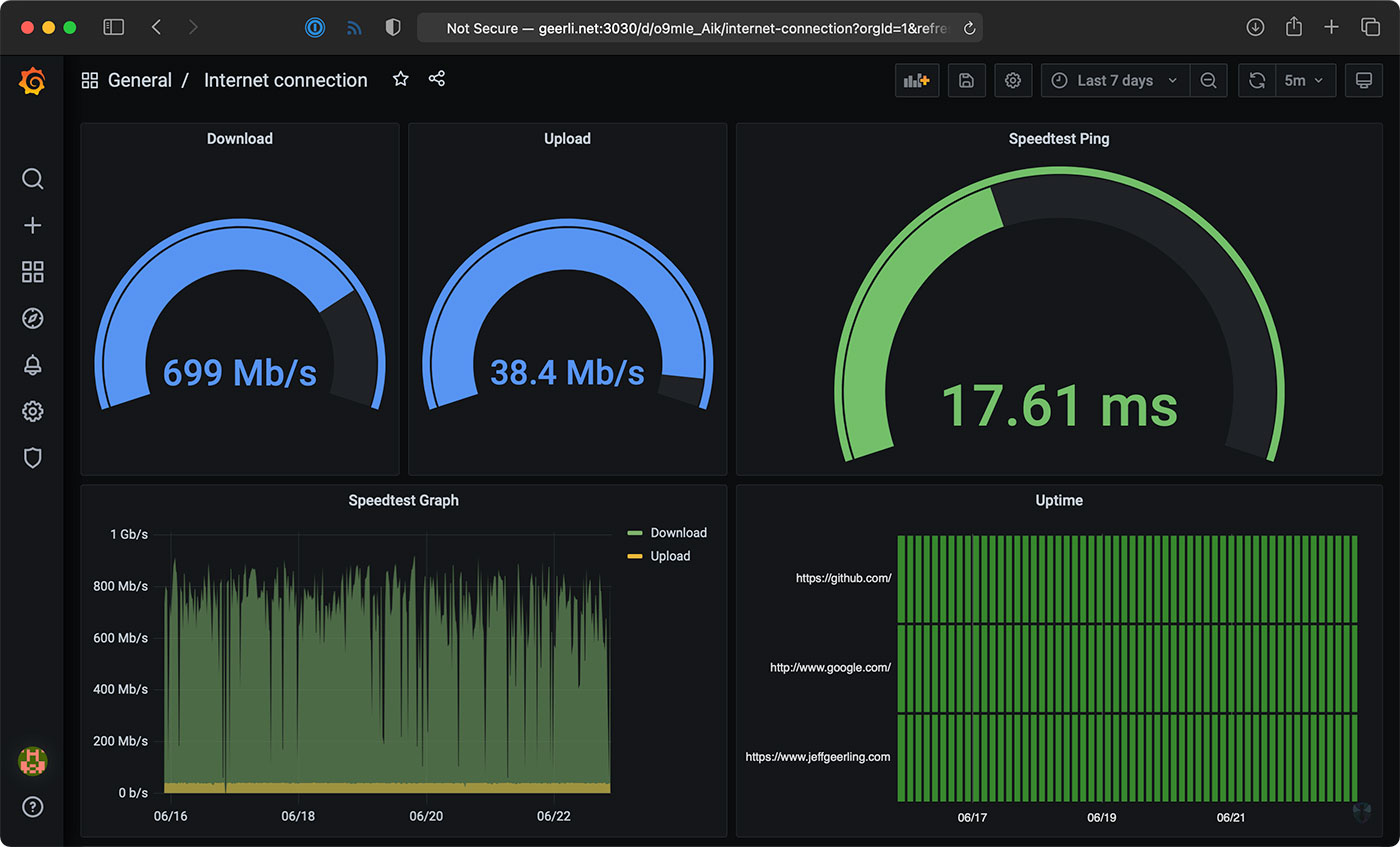
The Internet Pi runs Pi-hole for DNS privacy and ad-blocking, and Prometheus and Grafana to provide Internet connection monitoring dashboards.
Having a Pi monitoring my Internet continuously makes it easy to see trends over time, or confirm outages. If you just spot check by running a Speedtest every now and then, you don't have much data to go on.
Setting up Internet Pi
I built the free and open source internet-pi project on GitHub. It's simple to set up, and you can choose which parts of the platform you want to use.
I set up my Internet Pi from another computer, but you could also run the Internet Pi playbook on the Pi itself. Following the install instructions, you need to have a Pi set up with Raspberry Pi OS running on your network, and be able to SSH into the Pi.
Here are the steps to get it going:
- Make sure you have Ansible installed:
- (If
pip3is not installed)sudo apt-get install -y python3-pip pip3 install ansible
- (If
- Download the internet-pi repository to your computer:
git clone https://github.com/geerlingguy/internet-pi.git && cd internet-pi - Install the Ansible Galaxy content that's required to make the playbook work:
ansible-galaxy install -r requirements.yml - Make copies of the
example.inventory.iniandexample.config.ymlfiles (dropping theexample.from the filenames) and modify them for your own needs - Run the playbook:
ansible-playbook main.yml
The playbook installs all the tools you choose in your configuration file, and once that's done, you should be able to access your Pi's IP address in a web browser to see Pi-hole, or visit the IP address with the port :3030 on the end to see the Grafana dashboards.
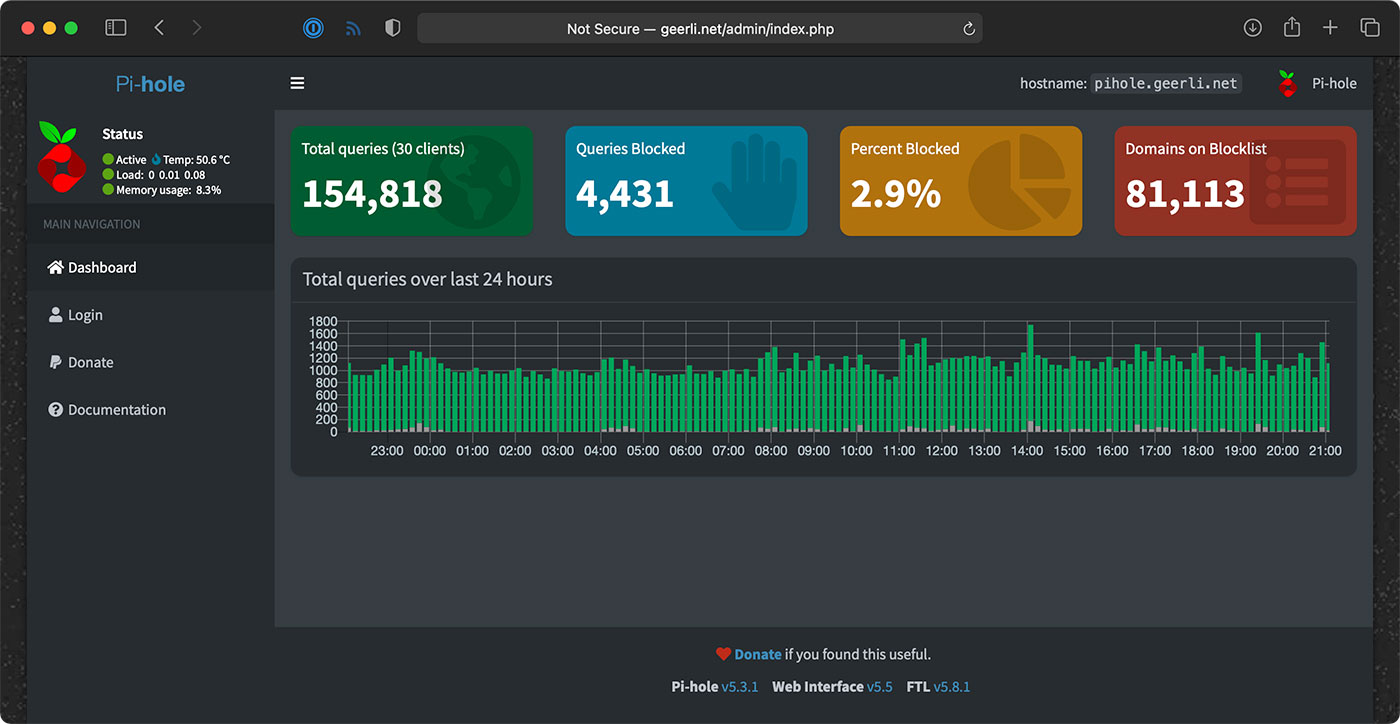
Setting up Pi-hole
If you wanna use Pi-hole as your home network's DNS server, you should configure your router to advertise the Pi's IP address as the primary DNS server for your whole home network. For extra redundancy, you could actually configure two Pis running Pi-hole, but that's a topic for another post!
But the great thing is, that allows you to see all the DNS requests your devices are making, and make sure (for the most part) things like so-called 'smart' TVs don't send tons of information to advertisers.
Pi-hole is a great first line of defense for your Internet privacy, at least at home, and it even has some other neat tools like a simple DNS server, if you want to use them.
Internet monitoring
The Internet monitoring dashboard is automatically configured for you, but it can take up to an hour before you start seeing data.
In my case, it's been running for a couple months, so I can see the Internet connection for the past day, week, or even longer!
The monitoring configuration runs one container that connects to Speedtest.net. Every 30 minutes or so, another container running Prometheus tells the first container to run a speed test.
NOTE: If you run this monitoring on your own network, be aware that these Speedtest.net checks will consume a good amount of data, especially if you run them more frequently. If you have data caps and want to use this monitoring solution, make sure to modify the check interval so you don't get an unexpected overage. ISPs, gotta love 'em!
It stores that data on the Pi, and the Grafana dashboard displays it over time. There's another service that does simple checks on websites you can configure for uptime and HTTP request timing stats—those lightweight checks are performed every few seconds, to give a detailed view when there is more latency in your Internet connection.
One thing I found interesting was my Cable internet connection—which is supposed to be one 930 Mbps—is only really about 700 Mbps on average.
Upload speeds are more consistent, so I begrudgingly pay for this high-tier plan... But I'd be a lot happier with 50 or 100 Mbps of asymmetric data, since I'm not downloading terabytes of files every day.
Starlink monitoring
The main reason I set this stuff up was to compare my Gigabit Cable Internet to SpaceX's Starlink Internet.
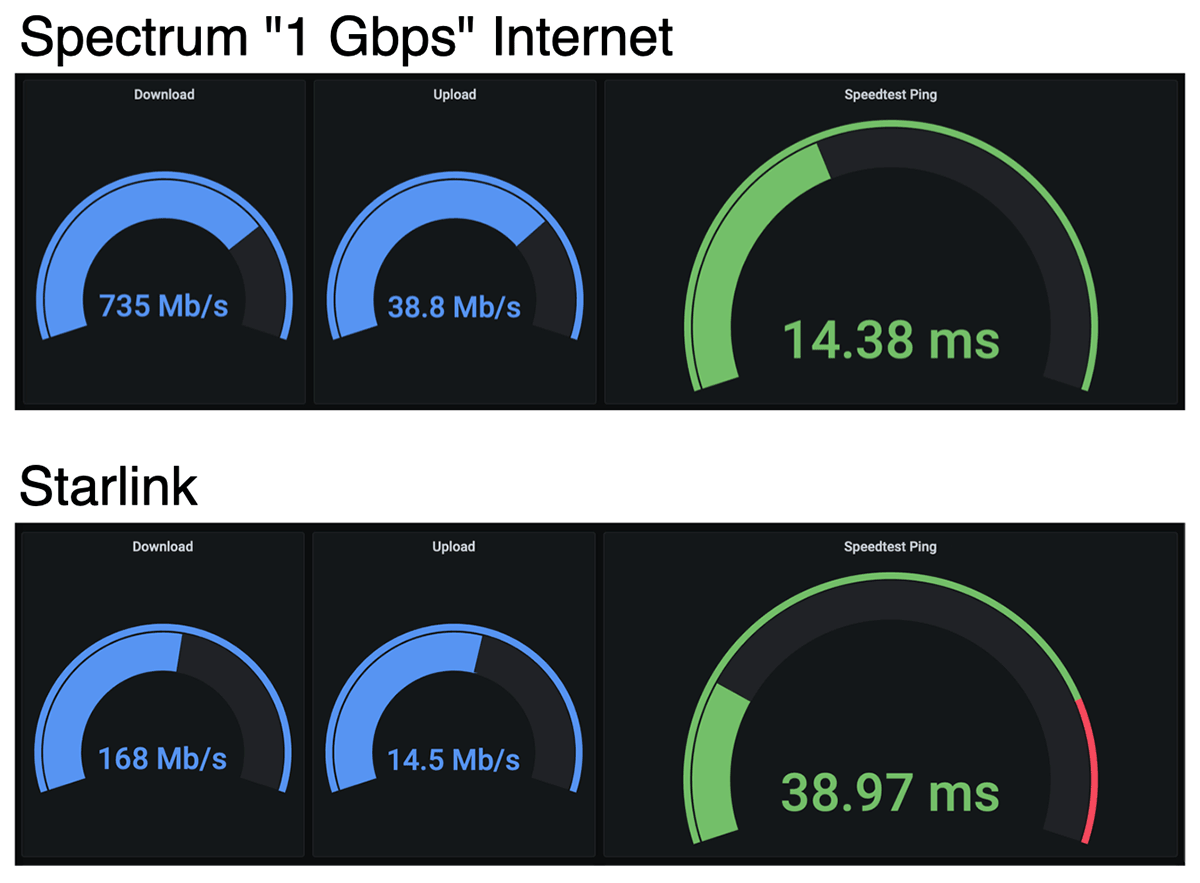
I'll get more into Starlink in a future review, but it looks like on average, when it has a stable connection, I get over 150 Mbps down, and 15 Mbps up, with 40 milliseconds of latency.
Those numbers are less than my Cable ISP; but Starlink also costs less—it's $99/month. And Starlink is also beaming the Internet through satellites up in the sky! For someone who doesn't have a fast Cable option (like rural customers), that's a mind-blowing upgrade from dial-up speeds.
But I mentioned earlier, there's also a Starlink-specific dashboard that gives all the details you'd normally find in the Starlink App.
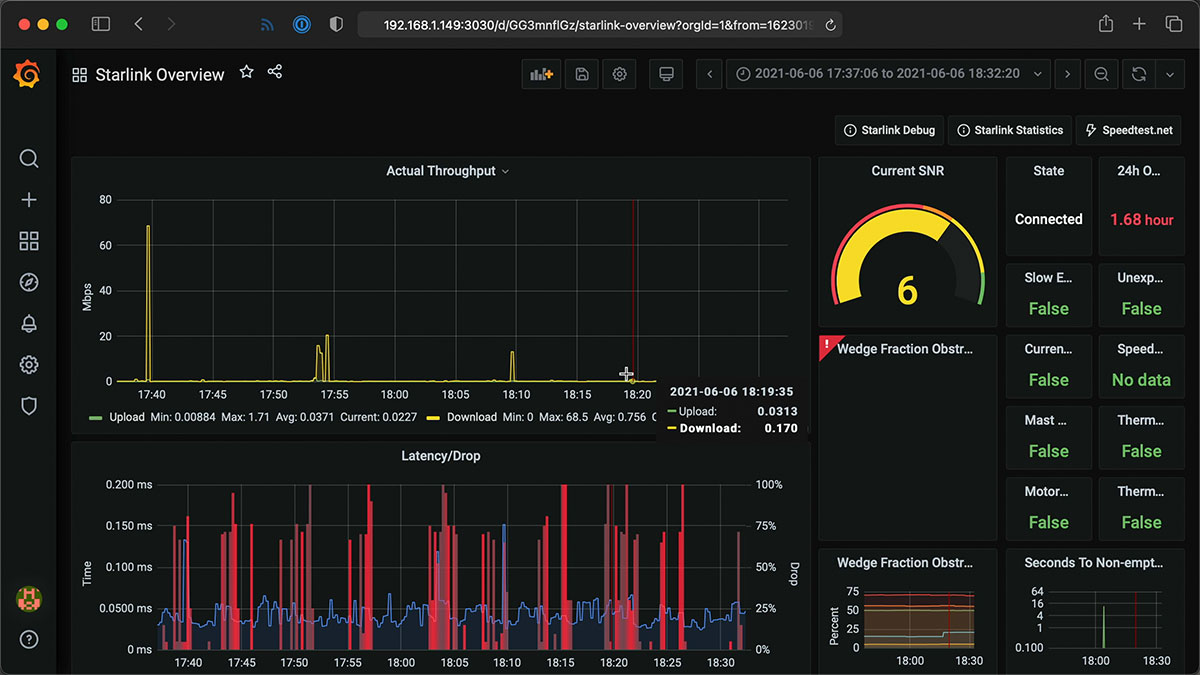
I haven't been actively using the Starlink connection today, so it's a little barren, but it gives a ton of detail, and I'd like to thank Daniel Willcocks (DanOpsTech) for making this possible; I'm using his Docker image and dashboard, and he even adjusted it to work on the Raspberry Pi after I asked about it!
Power monitoring
I also monitor Starlink's power consumption using a Shelly Plug US and a custom Shelly Plug Prometheus exporter I wrote:
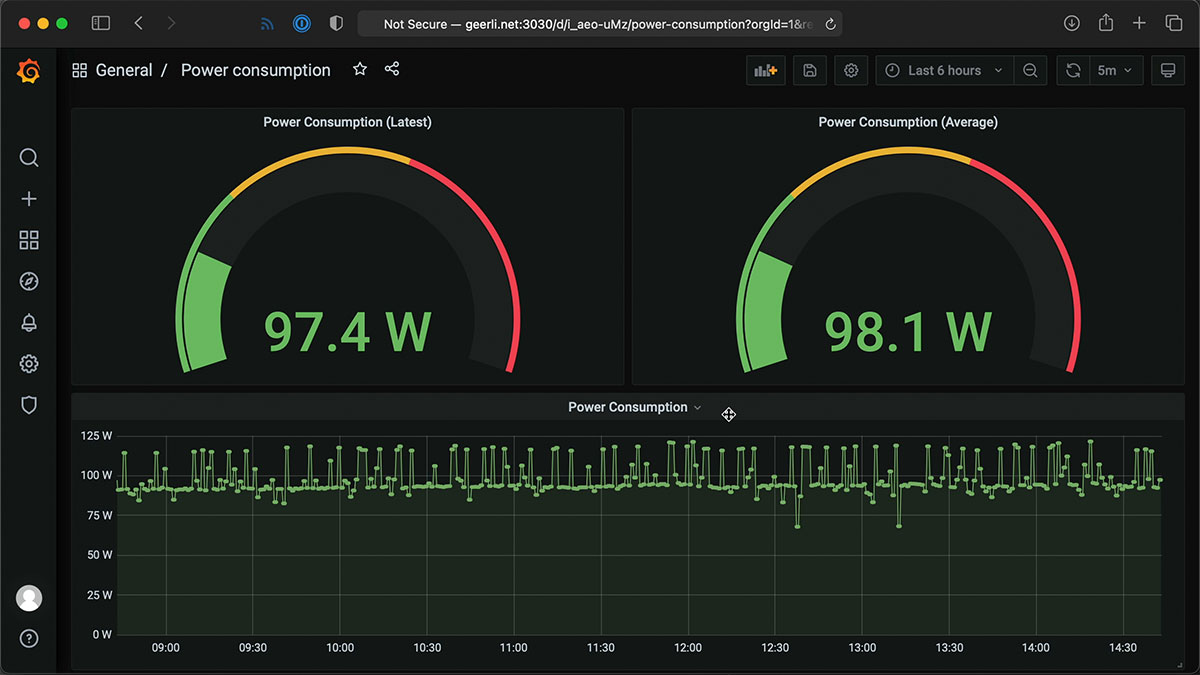
Starlink's dish and router use a lot of power (more than you might expect)—but I'll discuss more about that in my Starlink review coming soon! I have a blog post with more about how I set up the Shelly Plug power monitoring.
Conclusion
Now I know exactly how much my ISP is fleecing me for Internet. In Spectrum's case, it looks like they're only giving me about 3/4ths of what I pay for.
I wish I could just pay them $110 a month instead of $150, but if I did that, they'd cancel my service!
I'd like to thank Max Andersen for the original inspiration for the original monitoring configuration, the developers behind Pi-hole for making it free and open source, and especially Miguel who maintains the speedtest exporter, for his help getting some bugs fixed!
Comments
Are you using the latest version of the repository? There was a bug in the version that was available a few hours ago, but version 2.0.0 and the current
masterbranch should have that resolved. Do agit pullto get the latest version.Got it up and running -for the most part. Grafana isn't working. The docker image is there, but says port 3000, instead of 3030, and when I navigate to the site with :3000 (or :3030 for that matter), I get connection refused. I did have Grafana working for a little bit, but after a reboot, it failed and subsequent reboots haven't resolved it.
Thoughts?
Well, rebuilt my pi with the 64 bit raspbian and after a couple of updates, this worked like a charm. Everything is now working as it should. I think I might have read somewhere that the 32 bit was problematic, but breezed right over it. Now that it's up and running, I am fully functional and looking forward to seeing these stats in a week or so. Thanks Jeff for the wonderful blog posting! I'm now a follower!
Glad I could help :)
Thanks for this tool!
I am having issues at:
I can load Grafana, but there are no dashboards
Please make sure your
config.ymlfile has all the directives as defined inexample.config.yml— there were a couple new options added today.found the issue.
1) Grafana was working, I just had to navigate to the dashboard.
Dashboards ->manage
2) the error with pihole was due to me not needing to install pihole (previously done) and I mistakenly commented out the section in config.yml - one I uncommented it, and changed from true to false the playbook ran fine.
Only issue now, the speed test results for DL are about 1/3 what I get when I run "speedtest-cli" direct from the pihole CLI.
Upload is the same.
I got an error once the docker convenience scripts, below is the error
https://pastebin.com/WtLM5F8e
I have the same issue, did you ever get it sorted?
Is a Pi 4 required? I have a Pi 4 doing something that will not work on a 3B+, but have a few Pi 3B+ laying around gathering dust. Will the system work on one of these?
Thanks for the very high quality videos and information you provide. I never miss a single one.
Everything works on the 3 B+, but one major caveat is that if your Internet connection is better than about 300 Mbps, the 3 B+'s slower network IO will not be able to test the full range (it is limited to around 300 Mbps).
Well, I certainly don't have to worry about that!
Hi Jeff, thank you so much for this!
I installed this on my Raspberry Pi 4, first as local user, but then over SSH.
A few comments;
- Step 2 should be separated into two steps, the CD is not always respected by the OS
- After each install step - reboot the PI (I tried without rebooting, but it kept failing)
- Those not familiar with Grafana, have a look at the "Dashboards" - "Manage" tab to see the pre-configured dashboard. Set it as a favourite.
Again, thank you so much for this.
After 2 hours I have the following stats:
Download: 874 Mbps
Upload: 404 Mbps
Speedtest ping: 6.72 ms
Wow, I envy those upload and ping stats!
Hi, is there any comprehensive way for people like that don't understand how to install this?
I follow the instructions but I'm getting errors even with reboots.
The files do I need to create them and leave in the root?
Thanks a lot
Yeah i agree
I am hitting errors here too not long using linux here but trying and learning :)
Iam running into the following issue when running main.yml
msg: 'Error fetching key 04EE7237B7D453EC from keyserver: keyserver.ubuntu.com'
Me Too!
I wiped my pi and reinstalled raspbian os and ran the playbook and things went smooth. Thanks Jeff !
Very awesome to see this rolled in to a 'one stop shop'!!
Unfortunately, I botched this up pretty good the first go round on my rpi4 as I didn't initially grasp the inventory settings and was confused on whether this was based on source of installation (remote or local to the rpi), or if this was to determine how to access the web interfaces (if only accessible locally via localhost or on LAN via rpi IP).
Anyway, I did a full wipe and started over but get failure still when getting to the start pihole step (Host is already in use??). All other containers seem to start, and I can access grafana at rpi IP:3030. I can get the pihole container started manually (docker run pihole/pihole), but still cannot access pihole web interface at rpi IP :
fatal: [127.0.0.1]: FAILED! => {"changed": false, "errors": [], "module_stderr": "Starting pihole ... \nHost is already in use by another container\nStarting pihole ... error\n", "module_stdout": "", "msg": "Error starting project Encountered errors while bringing up the project."}
pi@pi-hole:~/internet-pi$ docker ps -a
CONTAINER ID IMAGE COMMAND CREATED STATUS PORTS NAMES
71f45fe7a092 pihole/pihole:latest "/s6-init" 20 minutes ago Created pihole
a571dfb4060e grafana/grafana "/run.sh" About an hour ago Up 17 minutes 0.0.0.0:3030->3000/tcp, :::3030->3000/tcp internet-monitoring_grafana_1
66de88ca9c1a prom/prometheus:v2.25.2 "/bin/prometheus --c…" About an hour ago Up 17 minutes 0.0.0.0:9090->9090/tcp, :::9090->9090/tcp internet-monitoring_prometheus_1
d447c6fcfe20 miguelndecarvalho/speedtest-exporter "python -u exporter.…" About an hour ago Up 17 minutes (healthy) 0.0.0.0:9798->9798/tcp, :::9798->9798/tcp internet-monitoring_speedtest_1
4c6c3fd93ed7 prom/node-exporter "/bin/node_exporter …" About an hour ago Up 17 minutes 0.0.0.0:9100->9100/tcp, :::9100->9100/tcp internet-monitoring_nodeexp_1
1d332ecfbd09 prom/blackbox-exporter "/bin/blackbox_expor…" About an hour ago Up 17 minutes 0.0.0.0:9115->9115/tcp, :::9115->9115/tcp internet-monitoring_ping_1
pi@pi-hole:~/internet-pi$ docker run pihole/pihole:latest
WARNING: The requested image's platform (linux/amd64) does not match the detected host platform (linux/arm64/v8) and no specific platform was requested
any advice is much appreciated, thanks!!
hi peps
i am really struggling with this i get to stage 2 no problems but then stage 3 just no joy -bash: ansible-galaxy: command not found
ok i am getting somewhere.im stuck on the edit for the ip address do i put eg 192.168.1.*** this "[internet_pi]
10.0.100.52 ansible_user=pi" changing 10.0.100.52 or is it best to change "# Comment out the previous line and uncomment this to run inside Rasberry Pi.
# 127.0.0.1 ansible_connection=local ansible_user=pi" the 127.0.0.1 to eg 192.168.1.***
thanks
Log out and log back in. Then retry.
You probably have this sorted now, but for anyone else searching this I had to reinstall ansible using apt-get to get the ansible-galaxy cmd to work
Thanks, mate! This helped me out
ThankYou Jeff, got past my "permissions issue".
Can i configure a service to restart this code on boot?
when i run the ansible-playbook main.yml command i get this error and i havent changed anything in the file
ERROR! no action detected in task. This often indicates a misspelled module name, or incorrect module path.
The error appears to have been in '/home/silent/internet-pi/main.yml': line 6, column 7, but may
be elsewhere in the file depending on the exact syntax problem.
The offending line appears to be:
pre_tasks:
- name: Load configuration.
^ here
Hi Jeff,
Can we have OpenVPN integrated into internet pi. this will be a good project.
Jeff, love your videos. What OS are you running on the pi that runs your internet monitoring?
Hello, I appreciate all the hard work and geekiness first of all. Second, how would I go about adjusting which server the speedtest cli uses? The server it finds most often has a good ping, but I know for a fact the DL speed is fubar.
Hi Jeff,
I love watching your Videos and I am new to all this Ansible, Grafana & Prometheus stuff.
What is the best way to learn more about it, any good suggestions for tutorials and so on?
Can you tell me, how I can reset all my data from Prometheus, to start my records new?
Im trying to run your code in Dietpi OS on Rpi 4 (i know this is not the right OS), it is stuck in the task:
TASK [Synchronize internet-monitoring directory.]
Error code:
fatal: [127.0.0.1]: FAILED! => {"changed": false, "msg": "Failed to find required executable rsync in paths: /usr/local/sbin:/usr/local/bin:/usr/sbin:/usr/bin:/sbin:/bin"}
Can you help to make work in Dietpi ?
Jeff,
Thank you for these amazing tools! I am so close on getting this going on my Raspberry Pi 4. It looks like I am getting all the way through to TASK [Ensure {{ ansible_user }} user is added to the docker group.]. I am getting the following error:
fatal: [127.0.0.1]: FAILED! => {"msg": "The task includes an option with an undefined variable. The error was: 'ansible_user' is undefined\n\nThe error appears to be in '/home/pi/internet-pi/tasks/docker.yml': line 44, column 3, but may\nbe elsewhere in the file depending on the exact syntax problem.\n\nThe offending line appears to be:\n\n\n- name: Ensure {{ ansible_user }} user is added to the docker group.\n ^ here\nWe could be wrong, but this one looks like it might be an issue with\nmissing quotes. Always quote template expression brackets when they\nstart a value. For instance:\n\n with_items:\n - {{ foo }}\n\nShould be written as:\n\n with_items:\n - \"{{ foo }}\"\n"}
How can I resolve the problem? Thank you!
I am currently here and working on fixing this problem but nothing as of yet
I tried different user names and went through all .yml files i could find in the main folder nothing as of yet
Hi Jeff,
Thanks for posting this! I'm trying to get this running, but am getting an error when I run ansible-playbook main.yml
I haven't made any changes to this file and I'm at a loss. If it makes a difference, I'm attempting to run this inside an unbuntu container on my Qnap NAS.
ERROR! no action detected in task. This often indicates a misspelled module name, or incorrect module path.
The error appears to have been in '/internet-pi/main.yml': line 19, column 7, but may
be elsewhere in the file depending on the exact syntax problem.
The offending line appears to be:
tasks:
- name: Setup Docker.
^ here
Thanks for this very useful tool and a great use for our old RPi 3. After several hours of very slow 30/30 Mb/s readings with the speed monitor our graph now shows steady 100/100, which is exactly what we're paying for.
This begs the questions: Do ISPs know when they're being "watched"? And should we expect a price hike from our ISP (Frontier), now that we're holding them to the speeds they promised? Or (Question #3): Am I just being paranoid?
Honestly, it's hard to hold them to something they didn't really "promise" in the first place (they only sold it):
FRONTIER DOES NOT WARRANT THAT THE SERVICE OR EQUIPMENT PROVIDED BY FRONTIER WILL PERFORM AT A PARTICULAR SPEED, BANDWIDTH OR DATA THROUGHPUT RATE, OR WILL BE UNINTERRUPTED, ERROR-FREE, SECURE, OR FREE OF VIRUSES, WORMS, DISABLING CODE OR CONDITIONS, OR THE LIKE.
Hello Jesff, sorry to bother you but can you do a video ahout install it in an ubuntu server (for instance) , i am a nuby in linux , and i try con install it but with not good result so far. Im sure i am note the only one of you viewes how has a homelab with VMs ;)
thanks for all you videos
Jeff, I am close in getting this to work but when attempting to run the playbook I get an error:
[WARNING]: provided hosts list is empty, only localhost is available. Note that
the implicit localhost does not match 'all'
[WARNING]: Could not match supplied host pattern, ignoring: internet_pi
[WARNING]: ansible.utils.display.initialize_locale has not been called, this
may result in incorrectly calculated text widths that can cause Display to
print incorrect line lengths
Thank you for helping a fellow St. Louisan out!
jeff,
after copying most .yml files using nano I now have it down to one error: Error reading config file (/home/pi/ansible.cfg): File contains no section headers.
file: '', line: 1
'---\n'
When I get to the step : ansible-galaxy install -r requirements.yml
I get the error "command not found".
Don't see previous comment to edit bit solved by rebooting. Stuck now on the Inventory and Config files. If I use them as is I get the following when trying to run ansible-playbook main.yml:
[WARNING] provided hosts list is empty, only localhoast is available. Note that the implicit localhost does not match 'all'
PLAY [internet_pi]******
skipping: no hosts matched
Are there any basic/ready to go versions I could start with? I'm learning by reverse engineering working things :)
Got this after running playbook: fatal: [localhost]:
FAILED! => {"msg": "The task includes an option with an undefined variable. The error was: 'ansible_user' is undefined\n\nThe error appears to be in '/home/pi/internet-pi/tasks/docker.yml': line 44, column 3, but may\nbe elsewhere in the file depending on the exact syntax problem.\n\nThe offending line appears to be:\n\n\n- name: Ensure {{ ansible_user }} user is added to the docker group.\n ^ here\nWe could be wrong, but this one looks like it might be an issue with\nmissing quotes. Always quote template expression brackets when they\nstart a value. For instance:\n\n with_items:\n - {{ foo }}\n\nShould be written as:\n\n with_items:\n - \"{{ foo }}\"\n"}
PLAY RECAP *************************************************************************************
localhost : ok=7 changed=0 unreachable=0 failed=1 skipped=2 rescued=0 ignored=0
So, I copied and pasted the commands from your tutorial above to setup the Internet Pi. When I get to the ansible-galaxy install -r requirements.yml command, the pi responds with "-bash: ansible-glaxy: command not found"
What have I missed I followed all of the steps up to that point?
Try rebooting - that worked for me. That got me 1 step further but still not operational.
In Theory this could run on any Linux based system correct?
Yes; it's optimized for Debian/Pi OS and only guaranteed to work on ARM64, but it should work on AMD64 and Ubuntu and other Debian-like distros. There are efforts to get it to also work on Arch, Rocky Linux, etc.
It does work on AMD64. I am running it on Raspbian in VMWare on my AMD laptop right now. It was tough though due to my limited knowledge of Linux. Had to manually download and install docker to get it to install.
I'm having a problem loading the play book on Ansible I keep getting this
[DEPRECATION WARNING]: Ansible will require Python 3.8 or newer on the controller starting with Ansible 2.12. Current version: 3.7.3 (default, Jan 22 2021, 20:04:44) [GCC 8.3.0]. This feature will be removed from ansible-core in version
2.12. Deprecation warnings can be disabled by setting deprecation_warnings=False in ansible.cfg.
[WARNING]: * Failed to parse /home/pi/internet-pi/inventory.ini with ini plugin: /home/pi/internet-pi/inventory.ini:4: Expected key=value host variable assignment, got: out
[WARNING]: Unable to parse /home/pi/internet-pi/inventory.ini as an inventory source
[WARNING]: No inventory was parsed, only implicit localhost is available
[WARNING]: provided hosts list is empty, only localhost is available. Note that the implicit localhost does not match 'all'
I check the inventory. ini file, but i not sure what I'm looking for to correct this. can someone help.
Can you open an issue on GitHub and paste the contents of that file? I'm guessing there's a line that is not correct or something like that.
I have the same issue here, is there a solution?
Hi Jeff,
First off thank you for all the wonderful material you produce and share, I have learned a lot from your videos and posts.
I was able to successfully set up Internet Pi on a Raspberry Pi 3 Model B (running PI OS 32bit) bit I am having difficulties trying to set it up on a Raspberry Pi 4 running Ubuntu (20.04.2 LTS). Everything runs without any problems until step five "ansible-playbook main.yml" when I receive the following message.
Unfortunately my knowledge of Linux and Ansible is limited and I have been unable to resolve the issue myself. Any help/advice you could offer would be greatly appreciated.
Regards,
Gerard
ERROR! this task 'ansible.builtin.import_tasks' has extra params, which is only allowed in the following modules: include, include_role, import_role, include_tasks, win_shell, win_command, add_host, shell, include_vars, import_tasks, command, script, set_fact, raw, group_by, meta
The error appears to be in '/home/ubuntu/internet-pi/main.yml': line 15, column 7, but may
be elsewhere in the file depending on the exact syntax problem.
The offending line appears to be:
handlers:
- name: Include handlers.
^ here
You need to make sure you're running a newer version of Ansible (2.9 or later). Please see the README for the project for the best install guide, to install Ansible with
pip3so it installs a newer version.Hi Jeff,
I am running Ansible version 2.9.6 and have ran the set up commands in the README file again but still receive the same response.
ubuntu@ubuntu:~/internet-pi$ ansible --version
ansible 2.9.6
config file = /home/ubuntu/internet-pi/ansible.cfg
configured module search path = ['/home/ubuntu/.ansible/plugins/modules', '/usr/share/ansible/plugins/modules']
ansible python module location = /usr/lib/python3/dist-packages/ansible
executable location = /usr/bin/ansible
python version = 3.8.10 (default, Jun 2 2021, 10:49:15) [GCC 9.4.0]
ubuntu@ubuntu:~/internet-pi$ pip3 list | grep ansible
ansible 2.9.6
That version might be too old - can you try doing
pip3 uninstall ansiblethen after that,pip3 install ansibleto get the latest version (should be 4.2.0 as of today).Can anyone tell me how to "reload" the contents / settings in config.yml? I changed one of the monitoring_ping_hosts and also the monitoring_speedtest_interval but Grafana hasn't changed even after a reboot. Thanks for any help.
You need to re-run the playbook with
ansible-playbook main.ymlto get it to update the configurations.Thanks so much Jeff! This is an awesome system you've given us!
One other question. When I look at the raw data from the .csv for speedtest downloads I see the results every 30 minutes which was my original setting in config.yml however I see an entry for a time range of 6 minutes. Does this mean the test is being run 6 times every 30 minutes. If this is the case I'll likely get FAP'd pretty soon from Xfinity.
Hmm, I'm not quite sure where that is coming from — but please file an issue over on GitHub with the details (maybe also paste some of the results there and how exactly you got the CSV out).
After slugging my way through the commands to setup the system on a fresh install on the Raspberry Pi OS (NOT intuitive and missing steps all along the way--this from a Linux user for the past 25 years or so), I finally got everthing installed and running. EXCEPT, when I go to the grafana dashboard at IP:3030, I get the dreaded "grafana failed to load its application files" error. Simply not worth my time to trouble shoot anymore. Despite high hopes, this is NOT ready for prime time certainly. Put out a short YouTube video when it finally is robust enough to actually use. Meanwhile I'll start a new search for a workable internet speed monitor...
Please open an issue on the GitHub repository with anything that was tripping you up along the way—it's my intention to make it as simple to set up as possible. Setting it up on a few of my own Pis went without a hitch, but maybe there are some assumptions I'm making that I shouldn't!
I can get Grafana to load but it is having an issue installing and running pihole. Please see error below.
fatal: [127.0.0.1]: FAILED! => {"changed": false, "errors": [], "module_stderr": "Creating pihole ... \nHost is already in use by another container\nCreating pihole ... error\n", "module_stdout": "latest: Pulling from pihole/pihole\nDigest: sha256:d2f764c4531515a1b93d5a8d1d82272ddc961e580f19c84ed764e4fa863823b1\nStatus: Downloaded newer image for pihole/pihole:latest\n", "msg": "Error starting project Encountered errors while bringing up the project."}
this is what happens when it tries to bring ensure pi-hole is running
fatal: [127.0.0.1]: FAILED! => {"changed": false, "errors": [], "module_stderr": "Recreating 982d684e2615_pihole ... \nHost is already in use by another container\nRecreating 982d684e2615_pihole ... error\n", "module_stdout": "", "msg": "Error starting project Encountered errors while bringing up the project."}
Do you already have pihole on your pi? I did and resolved the conflict by setting "pihole_enable: false" in config.yml. That took care of it for me.
Hello Jeff-- great stuff and pretty easy to install. The printed rack is pretty slick too.
One thing I'm noticing is that Grafana is showing around 30 down and 16 up. However, from my mac, wired I regularly see about 100 down and 15 up... if I move the mac to wi-fi, it's 71 down, 16 up. The mac and pmon are on the same ethernet switch with the same port config. I'm wondering if there are some performance tweaks I missed on the pmon?
I didn't see any info in this thread or on the blog-- topics were mostly install issues.
Great work and thank you!
Update to close the loop-- no issues with pimon- turned out that my firewall was not up to the task. Replaced that with dedicated hardware and now I'm seeing expected speeds. This build helped me identify a problem I didn't realize I had.
Thanks again!
can u kindly create a video how to set this up on pi please
Here you go! https://www.youtube.com/watch?v=rIUc4C4TXog.
Hi thanks for this it worked for me, we the internet speed test monitoring that is. I'd like to try the Power Usage side of things but, we don't have Shelley products I do however have a number of Smart Wi-Fi Sockets so I'm guessing they are similar Technology do you have more info on what your interrogating in the back end to get the information out of the device?
Maybe the MEROSS, Digitech BAUHN devices I have can be used they seem to either be MEROSS or Tuya Smart or at least those are the IDE's and Apps I've used to hack them with Homebridge. Col
Followed your directions exactly, but when I do the step "ansible-galaxy install -r requirements.yml" I get "-bash: ansible-galaxy: command not found". No idea what to do from here.
Hello.. tool seems cool... install on a PI using updated versions of all... however when it comes to seeing anything on a browser that does not work... IP:3030 and get error unable to connect. tried a few browsers which of didn't make a difference. Anything I can check?
How it going chaps
Anyone else get a error code 13 while trying to install docker compose
'Error while fetching server API version: {0}'.format(e)
docker.errors.DockerException: Error while fetching server API version: ('Connection aborted.', PermissionError(13, 'Permission denied'))
Cheers
You need to logout from the PI, log back in and rerun the playbook.
Hi Jeff, loving the data collection. It’s giving me a much better picture of how my network is behaving and makes it easier to find an issue when my wife’s IPad “stops working”.
I had opted to replace a PI 3B that was running Pi Hole & a GPS based NTP server (AT&T “throttles” NTP requests, which was messing up the VPN server I was running) with a 4B when I decided to try this out. (I had it lying around from some tinkering I was doing and figured this would allow me a minimum level of interruption on my network, and gives me a reasonable fall back).
So, I teleported my config from the old Pihole, set up things per your blog, and after a few false starts I had things working. I then applied the teleport, & shut down the 3B, and then everything went to sh*t.
You see was using the PiHole as my DHCP server, and it appears that since the PiHole is running in a docker container, this does not work as expected. What was really throwing me off was one or two devices were showing up in the DCHP Device lease list. I won’t bore you with all the trials I did to get things working, but I wound up enabling the DHCP server on my router to get things running again. Now that I had internet back, I found this page that told me what the issue was, & how to fix it: https://docs.pi-hole.net/docker/DHCP/
Now, in addition to that, I somehow managed to bork Grafana when I was trying to get the DHCP working (it is now refusing to connect on port 3030, which was working before), so I’m trying to decide how to proceed.
I do have an image backup of the 4Bs SD card prior to applying the teleport, so I could fall back to that, & modify the docker-compose.yml, as mentioned in the above link, but I know nothing about Docker, so I’m not sure where to look for this file.
My alternative is to do a fresh image, install PiHole “bare metal” & use your script just to install the internet monitoring.
I’d appreciate any insight / advice / guidance you may have.
Congratulations Jeff, amazing work. Been a follower since I found your "Ansible 101" on youtube, even got myself the book :).
Managed to install this first try with no issues although at one point I though that perhaps a raspberry pi 4 8Gb was a bit of a overkill, so now for some reason I keep getting the error below no matter what I do, I have seen a few comments with the same but no replies so far unfortunately.
TASK [Ensure Pi-hole is running.] ************************************************************************************************
fatal: [127.0.0.1]: FAILED! => {"changed": false, "errors": [], "module_stderr": "Creating pihole ... \nHost is already in use by another container\nCreating pihole ... error\n", "module_stdout": "latest: Pulling from pihole/pihole\nDigest: sha256:d2f764c4531515a1b93d5a8d1d82272ddc961e580f19c84ed764e4fa863823b1\nStatus: Downloaded newer image for pihole/pihole:latest\n", "msg": "Error starting project Encountered errors while bringing up the project."}
All other containers seem to be running but for some reason cant run pihole.
I have the same issue
Do you already have pihole running or have tried to install it in the past? You can get around it by changing the config file and changing pihole to "False".
i.e sudo nano config.yml (or what you have named your config file, if not changed than example.config.yml).
Hello Mr. Geerling,
First, please allow me to thank you for all your hard work and the all the good information you often provide to all us here in your page, and your YouTube channel.
I must admit that I do not know much about ansible, I have tried to follow your instructions, but I have not been successful at installing the Internet monitoring part of this project. I am sure it has to be something silly. Any advice you can give will be highly appreciated. Thanks in advance.
[WARNING]: Could not match supplied host pattern, ignoring: raspberrypi
[WARNING]: ansible.utils.display.initialize_locale has not been called, this may result in incorrectly calculated text widths
that can cause Display to print incorrect line lengths
3 questions
1 what does this mean 127.0.0.1 : ok=13 changed=1 unreachable=0 failed=0 skipped=16 rescued=0 ignored=0
2 how would i check if everything is running like its supposed to
3 my password that i set in the config file doesnt work how else would i login into the grafana dashboard
Thanks in advance
Hi Jeff!
Great project, been following your YT channel for a while now.
I'm trying to install it, but keep getting this:
Successfully completed tasks here :)
Some additional data:
Rpi 3b+
Processor: BCM2835
Distribution: Raspbian GNU/Linux 10 (buster)
Kernel version: Linux 5.10.17-v7+ armv7l
Thanks!
Hey Jeff,
trying to work this - bit of a pi newb here, though I'm an old linux sysadmin. This was a complete fresh pi install.
1/ the git page omits the "git clone..." command shown here
2/ Following the instructions and the ansible-galaxy command was not found... took some digging to realize that pip3 is installing programs into ~/.local/bin and while it seems to have updated my .profile, it did not actually update the active path. Easily fixed by logging out and in again (or just manually updating the path) but it still caught me by surprise. hmmm, now I'm doubting myself as the date-modified on the profile is not changed. Hmmm, maybe something else going on here...
Trying to set this up on a Raspberry pi 3b+ out of the box and step by step but IM getting errors regarding port allocation. "Bind for 0.0.0.0:9798 failed: port is already allocated."
In the host file I just put my local ip with 192.168.2.1, anyone have any ideas?
Great tutorial and video! I had zero issues with the install and setup however I've noticed my speed tests are much lower than they should be. I have a full Unifi stack with a UDM-Pro and Gen2 48 port PoE Pro switch powering my Pi.
So far I've run multiple iperf3 tests which are just under the 1 gig but the Pi speed tests are between 300 and 400 mbps consistent. When I run a speed test from the Unifi Controller (built in) it's getting in the 900's. When I just run a speed test from my browser I'm getting in the 800's. I'm not sure why the Pi is so low. Any help with this would be much appreciated.
First off, great instructions. Was able to get this setup on the second try!
Woke up this morning to a non-functioning Grafana and after a reboot I see "Ensure apt cache is up to date"
Love the project but had a quick question. Aside from the automated 30-60 minute test, any way to start a manual one? Thanks
On the Pi itself, you could install and use Speedtest CLI (or just run it manually inside the speedtest container).
Hello Jeff!
I just love your videos and this project was something I REALLY hoped for :-)
I have had a few issues here and there, and it seems like I cannot get it to work...
Right now I am at getting this error-msg:
[WARNING]: Could not match supplied host pattern, ignoring: internetpi
PLAY [internetpi] **************************************************************
skipping: no hosts matched
PLAY RECAP **********************
My Raspberry is called "internetpi" as well.
Not sure what I can/should edit to make it run.
Best,
Kurt
Norway
You need to make sure your
inventory.inifile has an[internet_pi]section at the top, and then the host defined below that line. Right now it looks like that inventory file isn't configured correctly.Hi Jeff, Love your videos, thank you.
I'm following your instructions for the internet-pi: https://github.com/geerlingguy/internet-pi/blob/master/README.md
When I get to:
$ ansible-playbook main.yml
... ansible throws an error that says:
Error! no action detected in task. etc....
It points to line 26, the first line under handlers:
- name: Include handlers.
ansible.builtin.import_tasks: tasks/handlers.yml
I'm clearly not an expert in ansible. Any idea what I've done wrong?
Thanks for your help,
George