debugging

Testing Raspberry Pi's new Debug Probe

Raspberry Pi Debug Probe Pi 4 model B and Pico W

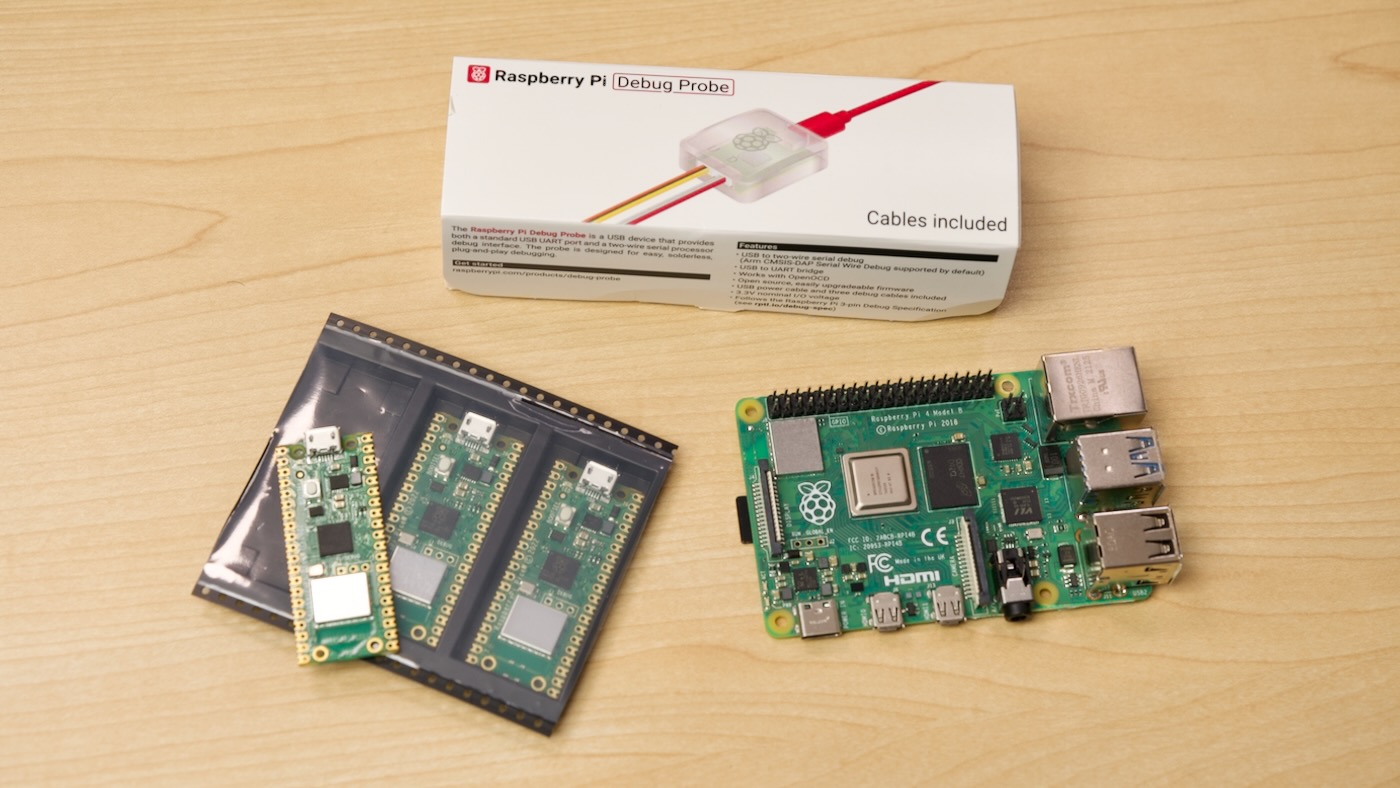
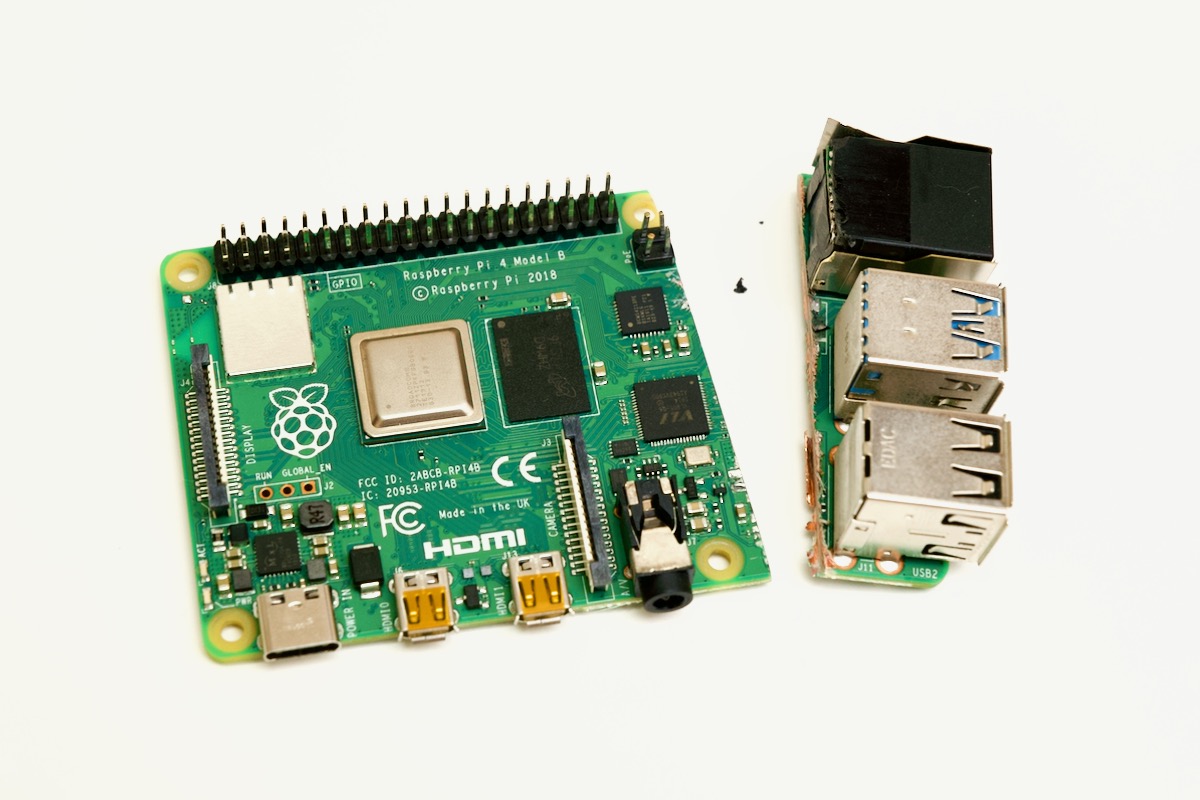
Yesterday, in tandem with Raspberry Pi's announcement of their new $12 Debug Probe, I received one in the mail (pictured above).

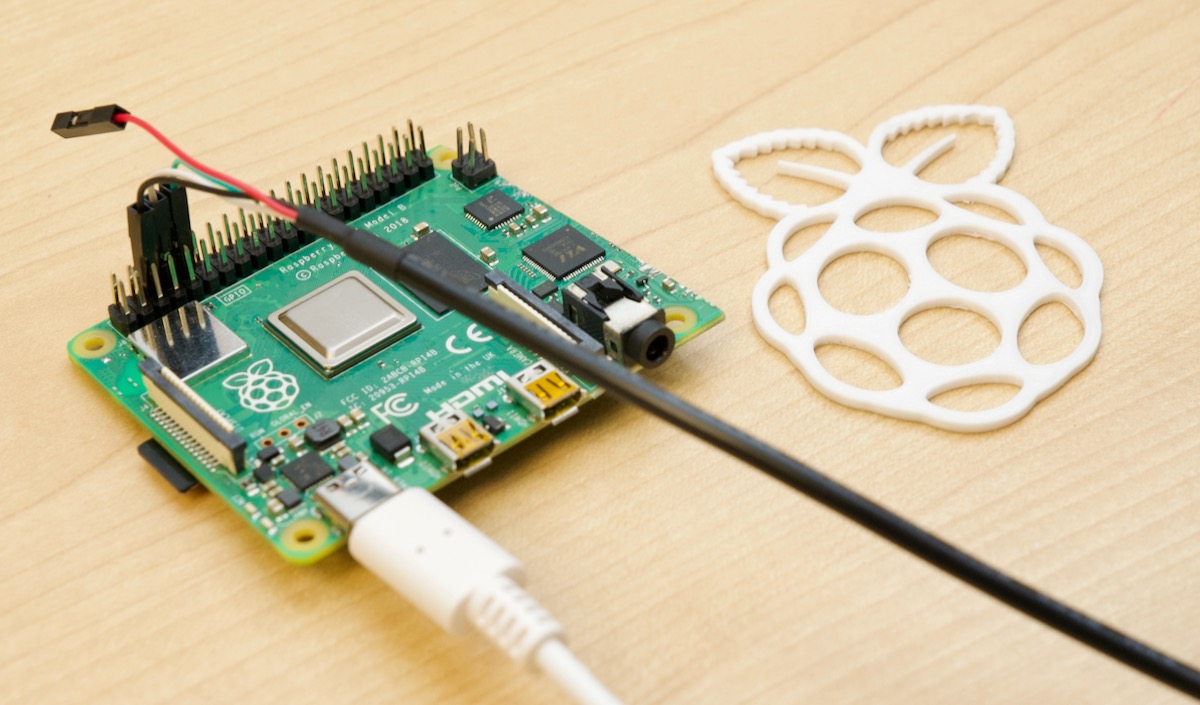
The Debug Probe is powered by an RP2040, and lets you connect from USB to UART (serial) or SWD (Serial Wire Debug), perfect for debugging most embedded devices.

UART is useful to connect to a device's console when you don't have a display or other means of controlling it, and you can find UART/serial/console ports on almost any device with a processor or microcontroller.

Getting a Raspberry Pi to boot after cutting it in half

This blog post starts with the question: If I cut the ports off a Raspberry Pi 4 model B, will it still work?

Cut Raspberry Pi 4 model B

My early conclusion? Sorta.

With most Raspberry Pi generations, there is a full-featured model B, and a smaller, trimmed-down model A. The Pi 4 never had a model A, so I thought it would be interesting to see if I could make one. I looked at the Pi 4 with this really cool X-ray tool, as well as using this album of X-ray images from reddit user u/xCP23x:

Xray image of Raspberry Pi 4 model B

The cut was calculated to try to avoid anything important, though as we'll find later it may not have been measured carefully enough.

Attaching to a Raspberry Pi's Serial Console (UART) for debugging

Sometimes a Pi just won't boot. Or it'll boot, but it'll do weird things. Or you don't have an HDMI display, and you can't log into your Pi via SSH. Or maybe you're like me, and someone 'accidentally' cut your Raspberry Pi in half, and you want to see what it's doing since it won't boot anymore.

Raspberry Pi with UART Serial Console Debug cable connected

The Raspberry Pi can output information over a 'serial console', technically known as a UART (Universal Asynchronous Receiver/Transmitter). Many devices—including things like storage controller cards, which in a sense run their own internal operating system on an SoC—have a 'UART header', which is typically three or four pins that can connect over the RS-232 standard (though many do not operate at 12v like a traditional serial port! Use a USB-to-TTL adapter like the one I mention below).

Simply Embedded has a great overview of UART if you want to learn more.

Debugging networking issues with multi-node Kubernetes on VirtualBox

Since this is the third time I've burned more than a few hours on this particular problem, I thought I'd finally write up a blog post. Hopefully I find this post in the future, the fourth time I run into the problem.

What problem is that? Well, when I build a new Kubernetes cluster with multiple nodes in VirtualBox (usually orchestrated with Vagrant and Ansible, using my geerlingguy.kubernetes role), I get everything running. kubectl works fine, all pods (including CoreDNS, Flannel or Calico, kube-apiserver, the scheduler) report Running, and everything in the cluster seems right. But there are lots of strange networking issues.

Sometimes internal DNS queries work. Most of the time not. I can't ping other pods by their IP address. Some of the debugging I do includes:

Follow logs from multiple K8s Pods in a Deployment, ReplicaSet, etc.

For production applications running in containerized infrastructure (e.g. Kubernetes, ECS, Docker Swarm, etc.)—and even for more traditional infrastructure with multiple application servers (for horizontal scalability), it is important to have centralized, persistent logging of some sort or another.

Some services like the ELK/EFK stack, SumoLogic, and Splunk offer a robust feature set for full text searching, filtering, and 'log intelligence'. On the other end of the spectrum, you can use a simple aggregator like rsyslogd or CloudWatch Logs without a fancy system on top if you just need basic central log storage.

But when I'm debugging something in a Kubernetes cluster—especially something like an internal service which I may not want to have logging everything to a central logging system (for cost or performance reasons)—it's often helpful to see all the logs from all pods in a Deployment or Replication Controller at the same time.

You can always stream logs from a single Pod with the command:

Fixing '503 Service Unavailable' and 'Endpoints not available' for Traefik Ingress in Kubernetes

In a Kubernetes cluster I'm building, I was quite puzzled when setting up Ingress for one of my applications—in this case, Jenkins.

I had created a Deployment for Jenkins (in the jenkins namespace), and an associated Service, which exposed port 80 on a ClusterIP. Then I added an Ingress resource which directed the URL jenkins.example.com at the jenkins Service on port 80.

Inspecting both the Service and Ingress resource with kubectl get svc -n jenkins and kubectl get ingress -n jenkins, respectively, showed everything seemed to be configured correctly:

Reverse-proxying a SOAP API accessed via PHP's SoapClient

I'm documenting this here, just because it's something I imagine I might have to do again someday... and when I do, I want to save myself hours of pain and misdirection.

A client had an old SOAP web service that used IP address whitelisting to authenticate/allow requests. The new PHP infrastructure was built using Docker containers and auto-scaling AWS instances. Because of this, we had a problem: a request could come from one of millions of different IP addresses, since the auto-scaling instances use a pool of millions of AWS IP addresses in a wide array of IP ranges.

Because the client couldn't change their API provider (at least not in any reasonable time-frame), and we didn't want to throw away the ability to auto-scale, and also didn't want to try to build some sort of 'Elastic IP reservation system' so we could draw from a pool of known/reserved IP addresses, we had to find a way to get all our backend API SOAP requests to come from one IP address.

The solution? Reverse-proxy all requests to the backend SOAP API.

Should I disable PHP warnings and notices?

This is a reposting of what I wrote on the Acquia Dev Center blog in 2016, Should I disable PHP warnings and notices?.

Drupal onscreen logged PHP error messages and warnings

Many developers who work on Drupal (or other web/PHP) projects have error reporting disabled in their local or shared dev environments, for a variety of reasons—some don't know how to enable it, some are annoyed by the frequency of notices, warnings, and errors, and some don't like to be reminded of how many errors are logged!

There are a few important reasons you should make sure to show all errors when developing, though:

Viewing email in Linux using postfix's mailq and postcat

When I'm developing using the Drupal Development VM, or checking into email processing on any of my servers, I usually use postfix to handle mail sending. Postfix is simple, preinstalled on most Linux distributions (and easy to set up if not), and is easy enough to use.

Here are the most common commands I use when either developing or troubleshooting email in production:

  • mailq - print a list of all queued mail
  • postcat -vq [message-id] - print a particular message, by ID (you can see the ID along in mailq's output)
  • postqueue -f - process the queued mail immediately
  • postsuper -d ALL - delete ALL queued mail (use with caution—but handy if you have a mail send going awry!)

There are many other helpful commands and scripts to help deal with mail (e.g. deleting all messages to a certain domain, or deleting specific message IDs easily), but these are the main ones I use during day-to-day development and troubleshooting.

Debugging Varnish VCL configuration files

If you're a Drupal or PHP developer used to debugging or troubleshooting some code by adding a print $variable; or dpm($object); to your PHP, and then refreshing the page to see the debug message (or using XDebug, or using watchdog logging...), debugging Varnish's VCL language can be intimidating.

VCL uses C-like syntax, and is compiled when varnish starts, so you can't just modify a .vcl file and refresh to see changes or debug something. And there are only a few places where you can simply stick a debug statement. So, I'll explain four different ways I use to debug VCLs in this post (note: don't do this on a production server!):

Simple Error statements (like print in PHP)

Sometimes, all you need to do is see the output of a variable, like req.http.Cookie, inside vcl_recv(). In these cases, you can just add an error statement to throw an error in Varnish and output the contents of a string, like the Cookie: