Internet Service Providers are almost universally despised. They've pushed for the FCC to continue defining 25 Mbps as "high use" broadband, and on top of that they overstate the quality of service they provide. A recently-released map of broadband availability in the US paints a pretty dire picture:

Here in St. Louis—where I guess I should count my lucky stars we have 'high use' broadband available—I have only two options: I can get 'gigabit' cable Internet from Spectrum, or 75 megabit DSL from AT&T.
That's it.
And you're probably thinking, "Gigabit Internet is great, stop complaining!"
But Spectrum's "gigabit" Internet is 930 megabits down—in ideal conditions—but only 40 megabits up. And that's the highest plan that costs about $150 a month!
Some would die for those speeds (see the map above), but much of the world is better off. And are you really getting the speeds you pay for? You probably don't know.
Well, I do, thanks to a $35 Raspberry Pi! And you don't even need a Pi, you could run the software I use on any computer. I just like having a dedicated computer to run all my Internet connection tools, so it's easy to backup or replace, and it doesn't get bogged down.
Video
I have a video that goes along with this blog post, and it's embedded below; skip past it if you prefer reading over viewing.
My Internet Pi
This is my "Internet Pi" (hostname geerli.net):
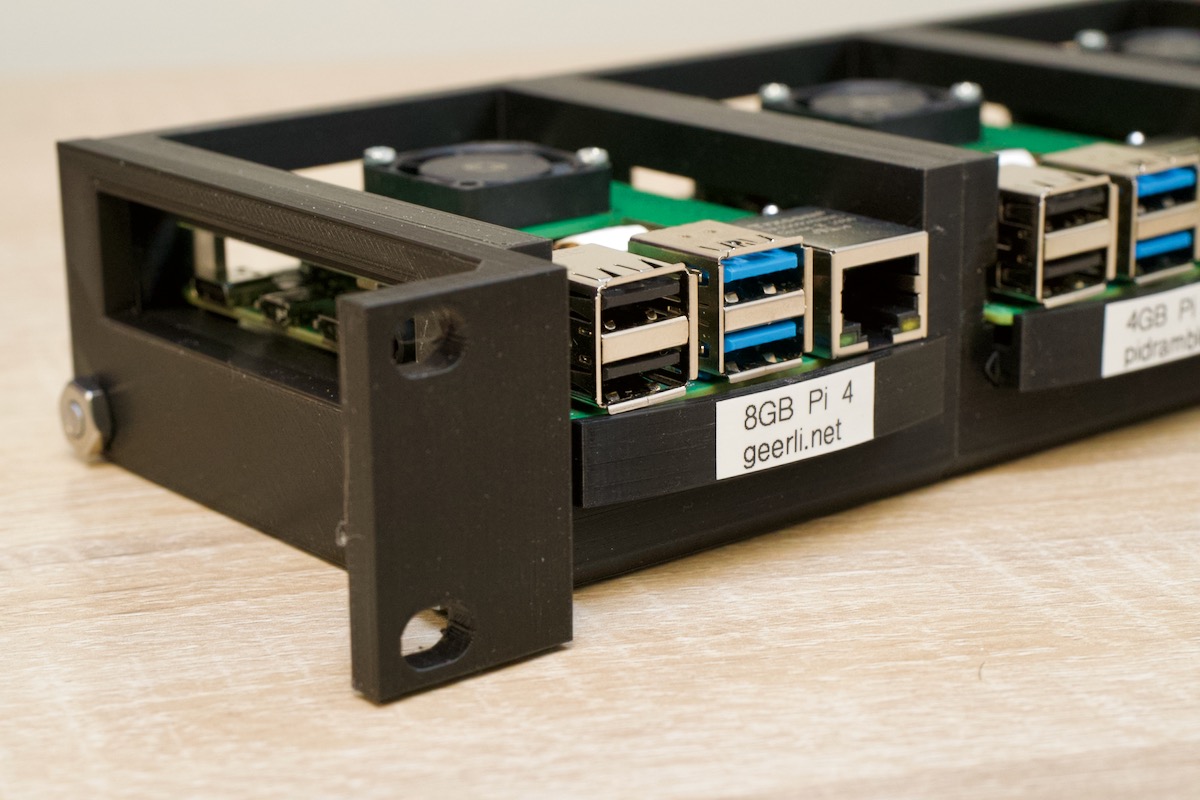
I have it installed in a rack (here's a video on the Pi rack), but it could just as easily be on my desk, or sitting by my Internet router.
The most important thing for measuring a network connection is that it's wired. WiFi, especially on the Pi, fluctuates quite a bit and is terrible for monitoring anything besides maybe WiFi signal strength.
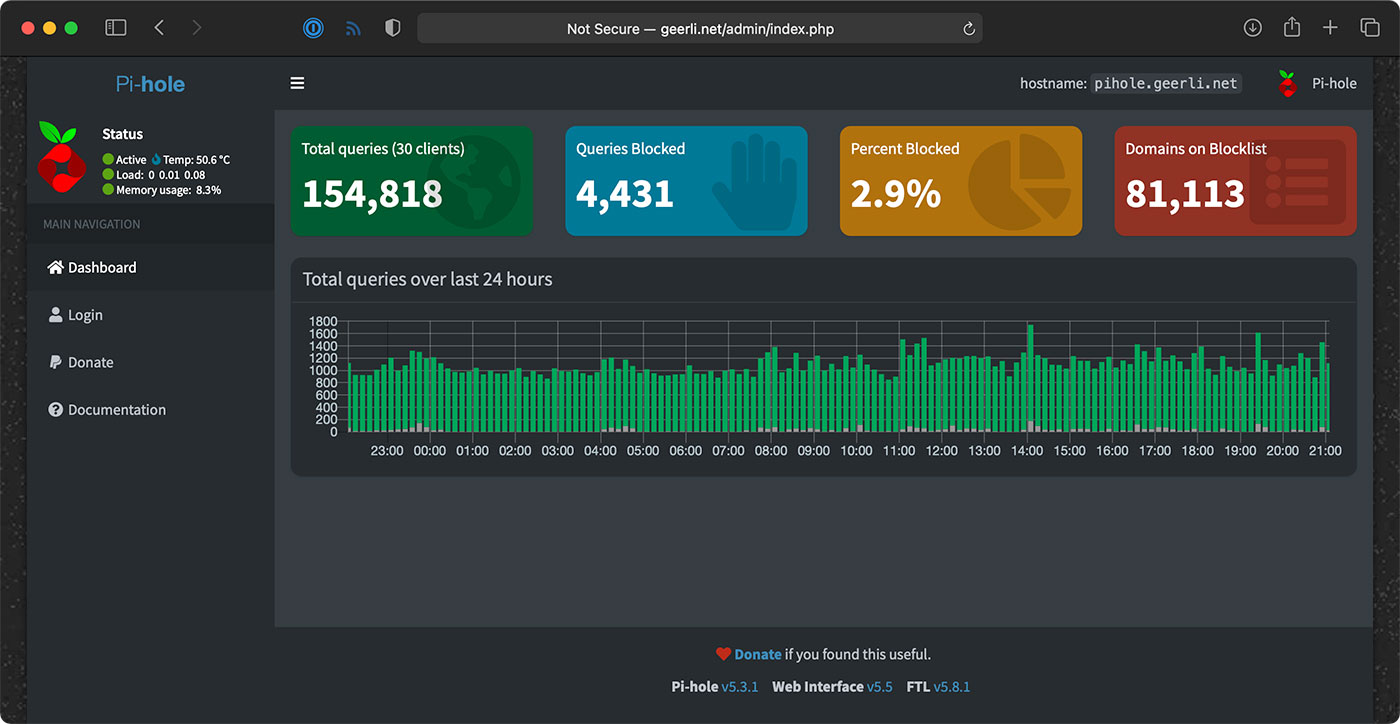
The Internet Pi runs Pi-hole for DNS privacy and ad-blocking, and Prometheus and Grafana to provide Internet connection monitoring dashboards.
Having a Pi monitoring my Internet continuously makes it easy to see trends over time, or confirm outages. If you just spot check by running a Speedtest every now and then, you don't have much data to go on.
Setting up Internet Pi
I built the free and open source internet-pi project on GitHub. It's simple to set up, and you can choose which parts of the platform you want to use.
I set up my Internet Pi from another computer, but you could also run the Internet Pi playbook on the Pi itself. Following the install instructions, you need to have a Pi set up with Raspberry Pi OS running on your network, and be able to SSH into the Pi.
Here are the steps to get it going:
- Make sure you have Ansible installed:
- (If
pip3is not installed)sudo apt-get install -y python3-pip pip3 install ansible
- (If
- Download the internet-pi repository to your computer:
git clone https://github.com/geerlingguy/internet-pi.git && cd internet-pi - Install the Ansible Galaxy content that's required to make the playbook work:
ansible-galaxy install -r requirements.yml - Make copies of the
example.inventory.iniandexample.config.ymlfiles (dropping theexample.from the filenames) and modify them for your own needs - Run the playbook:
ansible-playbook main.yml
The playbook installs all the tools you choose in your configuration file, and once that's done, you should be able to access your Pi's IP address in a web browser to see Pi-hole, or visit the IP address with the port :3030 on the end to see the Grafana dashboards.
Setting up Pi-hole
If you wanna use Pi-hole as your home network's DNS server, you should configure your router to advertise the Pi's IP address as the primary DNS server for your whole home network. For extra redundancy, you could actually configure two Pis running Pi-hole, but that's a topic for another post!
But the great thing is, that allows you to see all the DNS requests your devices are making, and make sure (for the most part) things like so-called 'smart' TVs don't send tons of information to advertisers.
Pi-hole is a great first line of defense for your Internet privacy, at least at home, and it even has some other neat tools like a simple DNS server, if you want to use them.
Internet monitoring
The Internet monitoring dashboard is automatically configured for you, but it can take up to an hour before you start seeing data.
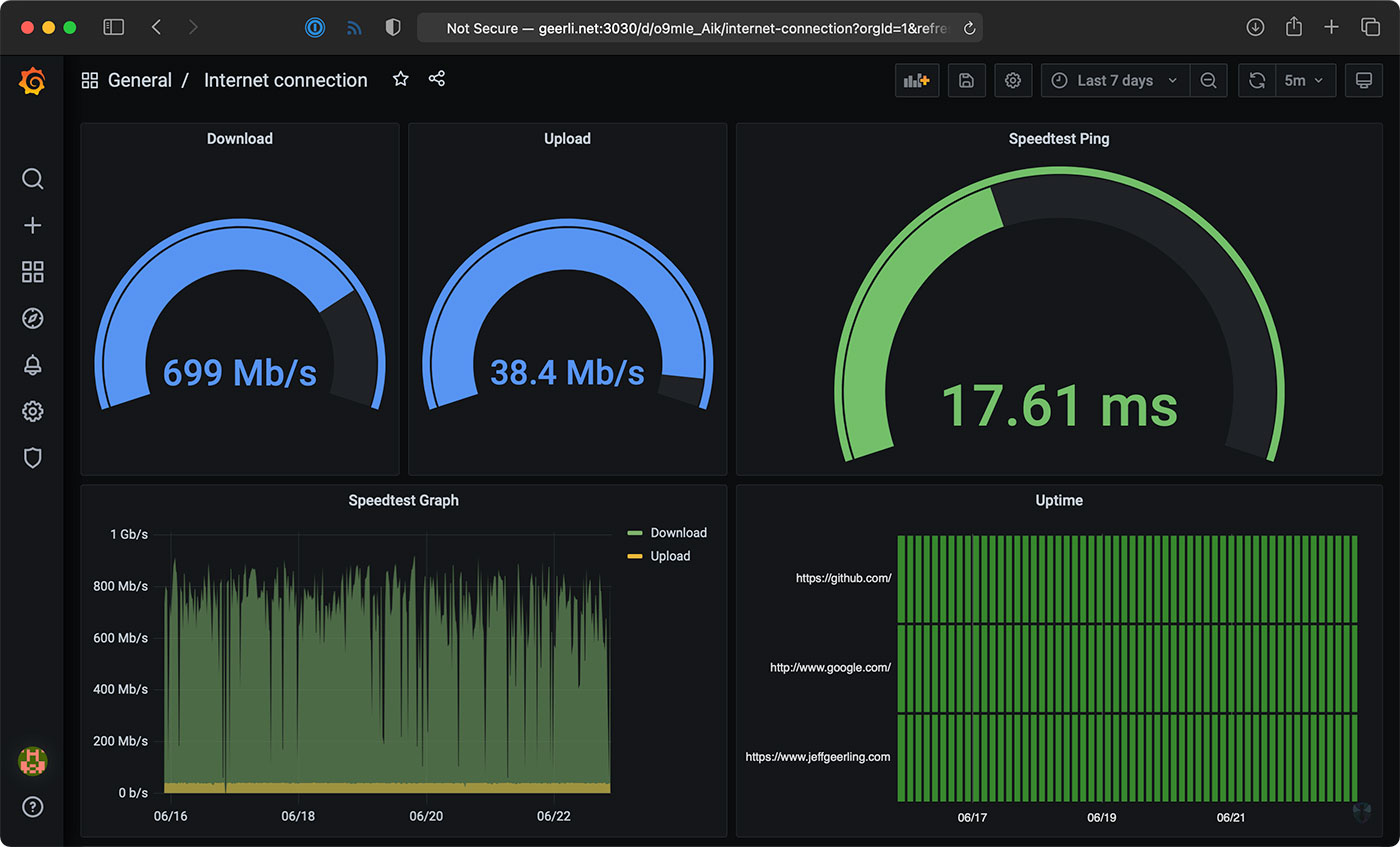
In my case, it's been running for a couple months, so I can see the Internet connection for the past day, week, or even longer!
The monitoring configuration runs one container that connects to Speedtest.net. Every 30 minutes or so, another container running Prometheus tells the first container to run a speed test.
NOTE: If you run this monitoring on your own network, be aware that these Speedtest.net checks will consume a good amount of data, especially if you run them more frequently. If you have data caps and want to use this monitoring solution, make sure to modify the check interval so you don't get an unexpected overage. ISPs, gotta love 'em!
It stores that data on the Pi, and the Grafana dashboard displays it over time. There's another service that does simple checks on websites you can configure for uptime and HTTP request timing stats—those lightweight checks are performed every few seconds, to give a detailed view when there is more latency in your Internet connection.
One thing I found interesting was my Cable internet connection—which is supposed to be one 930 Mbps—is only really about 700 Mbps on average.
Upload speeds are more consistent, so I begrudgingly pay for this high-tier plan... But I'd be a lot happier with 50 or 100 Mbps of asymmetric data, since I'm not downloading terabytes of files every day.
Starlink monitoring
The main reason I set this stuff up was to compare my Gigabit Cable Internet to SpaceX's Starlink Internet.
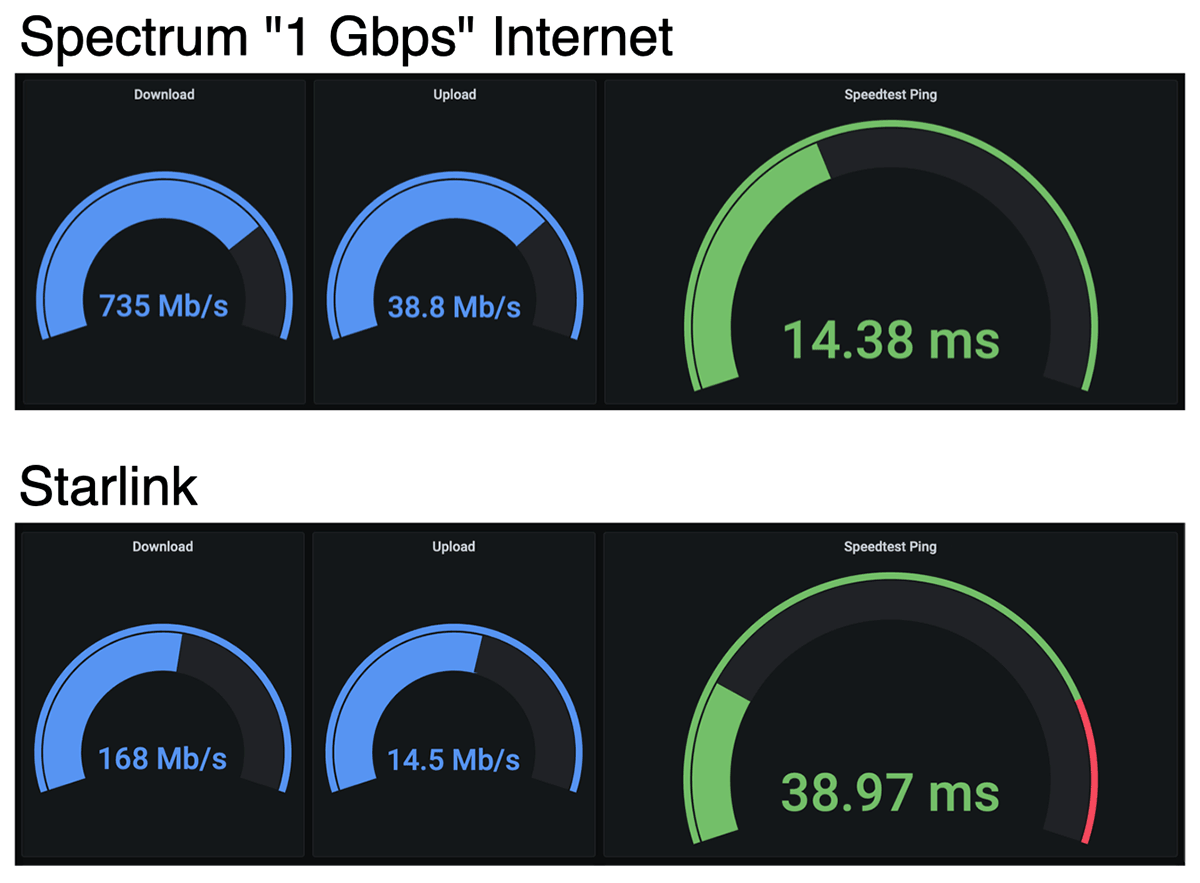
I'll get more into Starlink in a future review, but it looks like on average, when it has a stable connection, I get over 150 Mbps down, and 15 Mbps up, with 40 milliseconds of latency.
Those numbers are less than my Cable ISP; but Starlink also costs less—it's $99/month. And Starlink is also beaming the Internet through satellites up in the sky! For someone who doesn't have a fast Cable option (like rural customers), that's a mind-blowing upgrade from dial-up speeds.
But I mentioned earlier, there's also a Starlink-specific dashboard that gives all the details you'd normally find in the Starlink App.
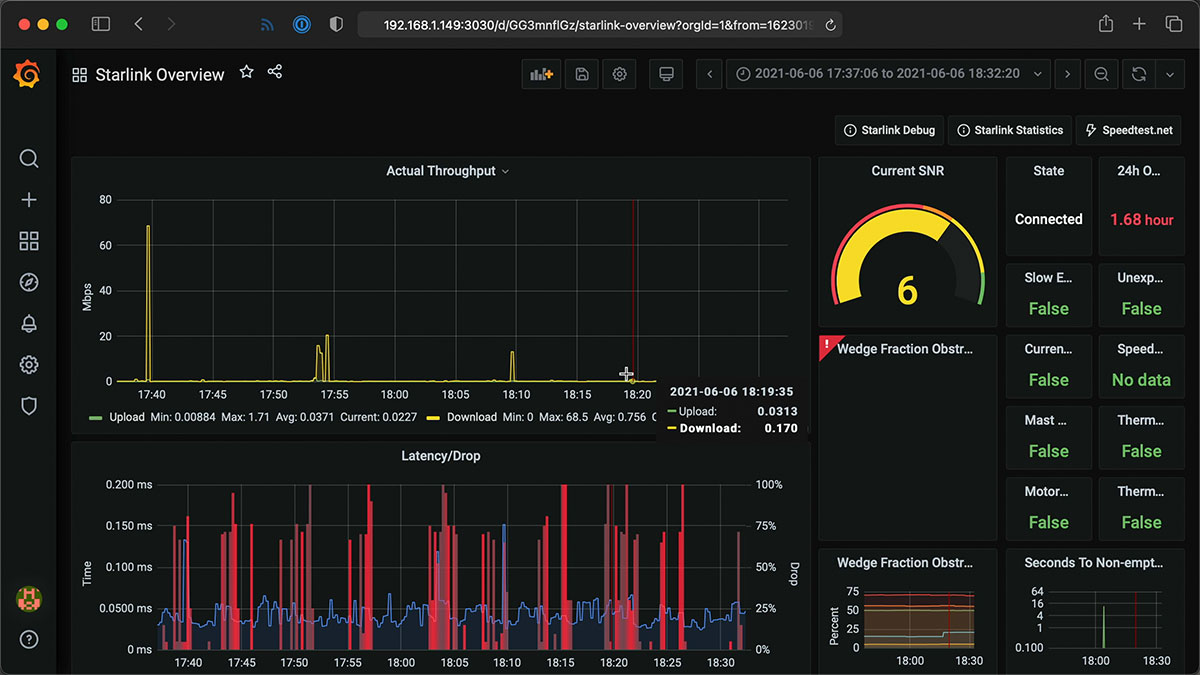
I haven't been actively using the Starlink connection today, so it's a little barren, but it gives a ton of detail, and I'd like to thank Daniel Willcocks (DanOpsTech) for making this possible; I'm using his Docker image and dashboard, and he even adjusted it to work on the Raspberry Pi after I asked about it!
Power monitoring
I also monitor Starlink's power consumption using a Shelly Plug US and a custom Shelly Plug Prometheus exporter I wrote:
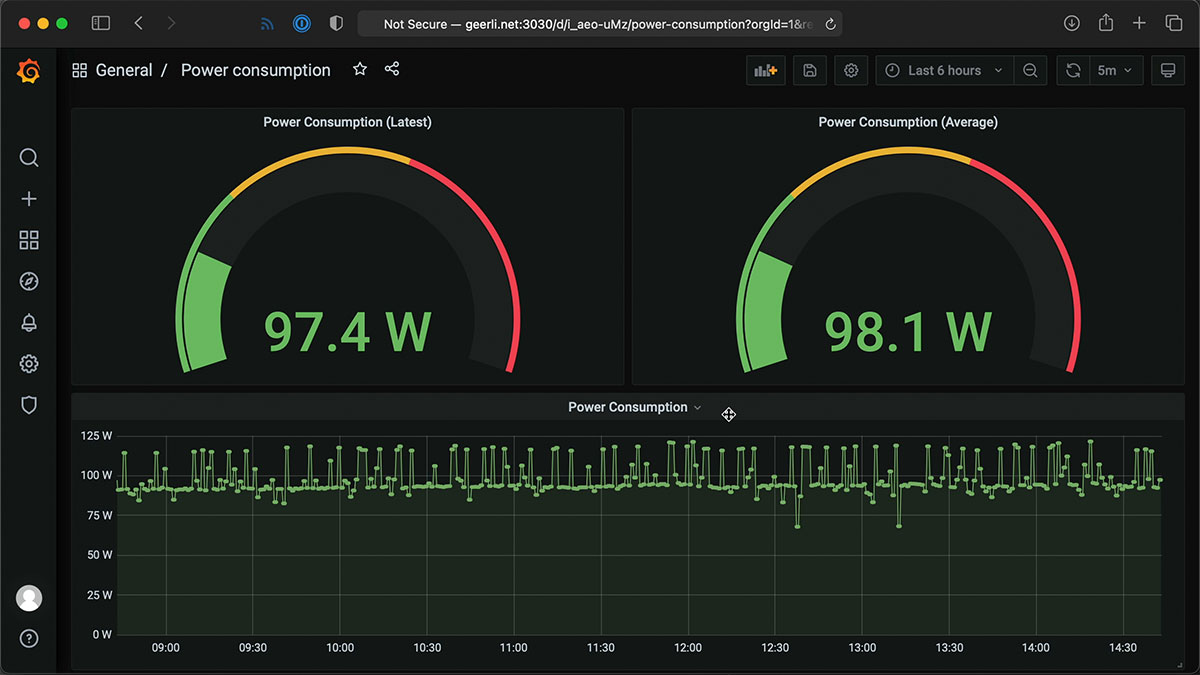
Starlink's dish and router use a lot of power (more than you might expect)—but I'll discuss more about that in my Starlink review coming soon! I have a blog post with more about how I set up the Shelly Plug power monitoring.
Conclusion
Now I know exactly how much my ISP is fleecing me for Internet. In Spectrum's case, it looks like they're only giving me about 3/4ths of what I pay for.
I wish I could just pay them $110 a month instead of $150, but if I did that, they'd cancel my service!
I'd like to thank Max Andersen for the original inspiration for the original monitoring configuration, the developers behind Pi-hole for making it free and open source, and especially Miguel who maintains the speedtest exporter, for his help getting some bugs fixed!
Comments
I installed Anisble after that cloned the github link after that when i tried to install the ansible-galaxy install -r requirements.yml it failed it got an error
Interesting—what version of Ansible are you running? If you're running an older version the collection install could mess up. Ideally you need to run the latest version of 2.9, or even better, Ansible 3.0 or 4.0 or later.
I am getting the same error. I was having the problem installing ansible-galaxy and followed the step that a pervious user to run sudo apt install -y ansible inside of the Internet-Pi folder. Once that ran fine, I was able to continue but am now getting an error when I run
sudo ansible-galaxy install -r requirements.ymlit is coming back withYou need to install Ansible 2.9 or later; the version installed via
aptis probably 2.8 (check withansible --version). 2.8 and earlier will not work, as they are not able to work correctly with collections. I would recommend installing Ansible with Pip, e.g.pip3 install ansible.Yes this was my problem. apt-get removed , installed pip3 and installed ok.
I'm getting the same collections error:
pi@pinet1:~/internet-pi $ ansible --version
ansible [core 2.11.2]
config file = /home/pi/internet-pi/ansible.cfg
configured module search path = ['/home/pi/.ansible/plugins/modules', '/usr/sh
are/ansible/plugins/modules']
ansible python module location = /home/pi/.local/lib/python3.7/site-packages/a
nsible
ansible collection location = /home/pi/.ansible/collections:/usr/share/ansible
/collections
executable location = /usr/bin/ansible
python version = 3.7.3 (default, Jan 22 2021, 20:04:44) [GCC 8.3.0]
jinja version = 2.10
libyaml = False
pi@pinet1:~/interne
I am also having this problem:
root@raspberrypi:~# pip3 install ansible
gets me:
ansible [core 2.11.2]
I reinstalled ansible as root because after I installed it as user, it couldn't be found in my path. After installing as root its in /usr/local/bin as expect. However I down see how that would affect the version of ansible that pip pulled down. How can I get a newer version of ansible?
My question would be... where do you find a RasPi 4 8GB for $35? :-)
I'm using the base 2GB model for this; no need for all that extra RAM since these containers are pretty lightweight. The Micro Center near me in St. Louis generally has them in stock, which is nice—not everyone is so lucky!
You can see how this would be confusing, since you focus on the 8GB unit in pictures and videos and don't really enumerate the hardware you used in the blog?
Ah, true. I just realized I do all my testing on 2 GB Pis, and also have the starlink Pi set up using the 2 GB model—however I do have the main "geerli.net" Pi running on an 8 GB Pi 4.
It's been running for over a month and that amount of RAM is completely unneccessary:
This would run just fine on a Pi with 1 GB of RAM too (like the earlier 4 model Bs, of which I still have one ;).
I have an 8GB, but I'm using it for VMWare. I started testing with my 1GB that I was setting up for a mirror. Still seems to have plenty of memory to work from. I worked through the missing installation pieces from some of the comments/links here in the discussion. Now I'm off to test things. Thx!
So I have 2 PI3B+ sitting around. Will they work for the system or does it need a PI 4?
It works but will only be able to measure connections up to about 300 Mbps reliably.
Installed into a VirtualBox VM running Debian. Working great! Thanks!
Now, how do we easily configure the monitored sites? I see it's checking connection to your server. I'd like to use it to monitor some servers at work.
I assume that you could install this to a VM in proxmox. I just started to tinker with proxmox, so I've got a lot to figure out still.
Figured out how to change the pinghosts.yaml after installation, just didn't see a way to make those changes in the original playbook...
Yeah, right now that's not a configurable option... follow this issue where I'll hopefully make it easier to override more options in the configuration.
One more thing... Changing the module from [http_2xx] to [icmp] in 'prometheus.yaml' and running 'docker-compose up -d' again doesn't change the module type. Any ideas on how to ping instead of looking for http responses?
How did you change it after install? I'd like to change these to my own sites in the dashboard.
See issue: Make it easy to configure which websites are pinged for HTTP checks.
Thanks for this work. I am trying to set ip up on a Pi that already has prometheus installed for another dashboard. How can I use your project with the existing Prometheus install instead of a second one, or does that matter?
The best thing would be to grab any of the export containers from my project you need, along with any of the Grafana dashboards, and inject them into your existing setup. The internet-pi project itself kind of mixes together a few things that way.
would be possible to add support for others smart plug?
i found some info about mine plug but don't have any idea how to use it
esphome-devices.com/devices/BlitzWolf-BW-SHP6
It may need a different Prometheus exporter configured for it.
I'm kind of lost at the config and inventory files step. I thought I set them up right but I'm getting a fatal error when I try to run main.yml:
What IP address should I be putting into
inventory.ini?I think you may be running into this issue: Can't run 'ansible-playbook main.yml' on Pi itself.
Basically try setting your
inventory.inito the following:Then run the playbook again.
Gotcha! I think we're getting there. I definitely goofed. I commented out [internet_pi] as well as the public IP line.
It ran through almost everything and then errored:
Check out this issue: PermissionError on "Ensure internet-monitoring environment is running." task.
I tried switching out, but it balked because ansible_user is undefined. I added it to the line as defined originally and it continued.
Howdy guys
Great work on this Jeff
Warning total n00b question here
How do you run a playbook ?
Error message
pi@raspberrypi:~ $ ansible --version
ansible 2.10.11
config file = /etc/ansible/ansible.cfg
configured module search path = [u'/home/pi/.ansible/plugins/modules', u'/usr/share/ansible/plugins/modules']
ansible python module location = /home/pi/.local/lib/python2.7/site-packages/ansible
executable location = /home/pi/.local/bin/ansible
python version = 2.7.16 (default, Oct 10 2019, 22:02:15) [GCC 8.3.0]
pi@raspberrypi:~ $ ansible-galaxy install -r requirements.yml
Ok so I am getting somewhere now well a step atleast
pi@raspberrypi:~ $ ansible-playbook main.yml
ERROR! the playbook: main.yml could not be found
I was looking for playbook: main.yml with ssh into pi with filezilla can change files and rename them but couldnt find main.yml anywhere
Hi Aaron,
Did you every find a soilution for this as I am also having exactly ythe same issue. The OS shows main.yml but the Ansible script can't find it.
Regards Hawkeye
You actually have to be in the `internet-pi` directory, which you should download: `git clone https://github.com/geerlingguy/internet-pi.git && cd internet-pi`
I installed ansible with: "pip3 install ansible"
Now when I run "ansible-galaxy install -r requirements.yml" I get:
I'm sure I'm missing something basic...
Is it possible you mis-typed the command?
ansble-galaxyis notansible-galaxy...Jeff, new guy to your blog (and to Pi's) but I've been having a lot of fun learning new skills tinkering around with these.
I ran into the same issue of the ansible-galaxy command not being found.. Here is the sequence I ran through to prep my Pi for this little project:
Step 1 - Fresh install of Raspberry Pi OS Lite
Step 2 - sudo apt-get update
Step 3 - sudo apt-get upgrade
Step 4 - sudo apt-get python3-pip (required to get "pip3 install ansible" to work)
Step 5 - sudo apt-get git (required for git command to work for your repository)
I then followed your instructions in the blog post, but when I ran Step 3 - i get the same error. And I checked my spelling multiple times (and CTRL-V'd it from your blog post). Same error:
-bash: asnible-galaxy: command not found.
At one point, it was giving me the error that it could not find ansible-galaxy in /usr/bin. And when i check that locaiton there is nothing related to ansible in that directory.
Thoughts?
Hmm, it could be that Ansible is being installed somewhere that's not in the
piuser's default$PATH. I'm currently away from my house so can't test on a fresh Pi install, but I know Pip can install a few different places depending on how it's configured. Can you see if/usr/local/binis in the$PATH? I think Pip might install there by default... but I could be wrong. Or if installing with--userit installs elsewhere, in your home directory.After loggen out and logging in, the command works
You need to log out and log back in to refresh the environment variables, then you should be able to use ansible-galaxy.
Hi Jeff,
No I typed the line correctrly but needed to reboot the Pi which fixed that problem. Now I am trying to run the playbook and am coming up with a "Can't find main.yml" error like the post above. Any ideas?
(also as an aside it gives a warning about the software being deprecated and a need toi upgrade Python, what version do we need as I did this all as a fresh install.)
Regards Hawkeye
I had the same problem. I found
sudo apt install -y ansible
and I could continue on.
:)
THIS! Fixed the command not found error for me.
You need to logout and log back in.
Just for future reference I solved using instead:
sudo -H pip3 install ansible
-Thx
Got it all working (Thanks!) but I cannot log onto Grafana. Tried admin/admin and also pi/ and admin/ (where is what I set up for the pi account on the Pi), Any ideas?
Please follow this issue. Right now the default is
admin/wonka.Exellent - that's got it. Thanks for all your work (and sorry about posing twice - didn't see the admin message first time).
Heh, no problem!
This didn't work. I found the details on a stack overflow post that says the default is admin/admin.
Thanks Jeff for posting this project! I had it set up quickly except couldnt log in to Grafana.
admin/admin worked for me to login to Grafana. The password "monitoring_grafana_admin_password" is in the config.xml file but didnt apply somehow
Thanks Ken for posting this default password.
Jeff, your awesome for even monitoring this thread. I running your ansible script that I already have PiHole installed with the PADD display. I get the following error. This is the second time I've ran it, and it just ran until it got the error. The first steps ran fine. Running the command under sudo probably won't fix this. Is the some directory permission I running into?
Please see this issue in the main repo: PermissionError on "Ensure internet-monitoring environment is running." task
hei jeff,
thanks for being! you are awesome and a fun to watch. Especially your bloopers :))
I have a question! from where do you buy rasps?
no amazon answer pls
Most of the time my local Micro Center. Sometimes Vilros, Chicago Electronics Distributors, PiShop.us, or elsewhere, always from one of the recommend Pi resellers linked from the Raspberry Pi website, since they sell at list price and shipping is generally not crazy.
oh, the perks of living the american dream
:))
i heard a lot about microcenter, looks like is not micro at all
i live in europe and here a raspberry is 1 expensive 2 not easy to come around
Hello!
Any chance you could write a quick little guide on how to uninstall all this?
Somehow I have ruined everything on my Pi.
Sure! Basically uninstall Docker, then delete all the directories created by this project:
rm -rf internet-monitoring pi-hole shelly-plug-prometheus starlink-exporterin the Pi home directory. Everything is run as a Docker container, so it should be well-insulated from the rest of the system.Hi Jeff, thanks for putting this together. I am running into issue with my password in config.yml. I get the following error:
If I comment the password field, it gets through most of the installation, but errors at the end with error message provided. I am installing on Proxmox VM running Ubuntu 20.x.
You likely need to quote your
pihole_password: "quoted-password-here", especially if it contains any special characters.Hi Jeff, this has been very helpful. I started out using internet-monitoring project first. Then you directed me to this project which also uses pihole. The terminal says all 14 tasks are running, but when I visit 3030, it seems to still take me to the original internet-monitoring site. I don't see be see a dashboard to configure pihole. Any hints?
Pi-hole should be at the IP address by itself (not at port 3030).
Are you in area that gets 5G wireless home internet? St. Louis, 5G Home Internet is here! Find out if it’s available in your area. www verizon.com/local/st-louis-mo/
"Verizon Home Internet services are not currently available at this address. Enter your contact information below to be the first to know when it becomes available."
What speedtest application does this project use? I have found that testing using the speedtest-cli from the raspberry pi apt package system does not test well above 600 - 700 Mbps on my RPi4. I have found that getting the CLI application direct from speedtest.net (https://www.speedtest.net/apps/cli) to be much more reliable at testing my Gig connection... a consistent 940Mbps down.
Latency: 11.75 ms (54.57 ms jitter)
Download: 940.78 Mbps (data used: 1.3 GB)
Upload: 107.37 Mbps (data used: 84.5 MB)
I'm looking forward to setting this up on a pi when I find myself some time.
Thanks for all the great work you do.
Stephane
It's using the CLI installed in a Docker container version 1.0.0 straight from Speedtest.net; see https://github.com/MiguelNdeCarvalho/speedtest-exporter.
Hi mate, great work. I have got this working and am only using the internet connection part.
its been running for a few hours now and the ping request parts are working but it doesnt seem that any speedtest has occured.
any ideas? thanks.
It could be the Speedtest container is not running correctly—that can be a problem on 32-bit Pi OS sometimes. Check the GitHub issues to search for the problem.
Hi already have a pihole set up on a Linux vm how can I just set up the monitoring part.
You can set it to not configure Pi-hole in the
config.ymlfile. Just set thepihole_enabletofalseinstead oftrue.Hey, nice project. Congrats. I just have one question that always bugs me when measuring internet speed. Do you take into account if other devices are using the connection?
Not automatically, no; you should also check in your router which (hopefully) has a traffic monitor to see if anything else is also using bandwidth at the same time as your speedtests, as other devices on the network can affect speeds.
I was able to load this on a Pi where I had already loaded pi-hole successfully. Just be sure to mark the pi-hole portion as false in the config.yml file. Plus I was able to run it locally by properly changing the inventory file.
Thank you for a great set of tools.
Excellent!
I have a pi-hole running on an older pi. It would be interesting to add the internet checking to it but don't want to screw up my configs by running this. Any thoughts on how to add this on top of an existing pi-hole config?
You can set it to not configure Pi-hole in the
config.ymlfile. Just set thepihole_enabletofalseinstead oftrue.I have changed true to false, but Pi-Hole keeps loading??
Jeff, love your videos. I'm running into a fatal error:
fatal: [127.0.0.1]: FAILED! => {"changed": false, "msg": "Unable to start service docker: Job for docker.service failed because t he control process exited with error code.\nSee \"systemctl status docker.service\" and \"journalctl -xe\" for details.\n"}
I also had to install Ansible globally as the Pi would not recognize the "ansible-galaxy collection install -r requirements.yml" command.
Any idea?
Please check the issues on the GitHub repo; and also try out
systemctl status docker.serviceto see what's going on.My Docker Status after reboot is:
docker.service - Docker Application Container Engine
Loaded: loaded (/lib/systemd/system/docker.service; enabled; vendor preset: enabled)
Active: active (running) since Fri 2021-06-25 06:26:11 EDT; 23min ago
Docs: https://docs.docker.com
Main PID: 641 (dockerd)
Tasks: 12
CGroup: /system.slice/docker.service
└─641 /usr/bin/dockerd -H fd:// --containerd=/run/containerd/containerd.sock
When attempting to access via IP:3030 I get a site cannot be reached error.
Well shucky darn. I'll just wipe my PI and start over. I'll be driving through St. Louis next Tuesday as I head to family in KS.
Wave to the Arch as you drive by, it's tradition here!
Where might one specify which URL's are used in the UpTime and http request duration graphs?
Did you find it?
Thanks Jeff! Just installed this great tool on one of my pi's and guess what? I pay for 50 up/50 down and I seem to to get 60 up/ 60 down =) https://pasteboard.co/K86kF8L.png
What server does the speed test choose? Can this be edited to choose a custom server or when closer/further away?
Right now it chooses whatever
speedtest-clipicks (based on your region and Speedtest.net's servers). It can be overridden to specify a server but that feature isn't yet exposed easily—see https://github.com/geerlingguy/internet-monitoring/issues/19.Following the instructions to clone the repo and install Ansible. Is there an additional package/command to install ansible-galaxy ?
It should be installed if
ansibleis installed (I usepip3 install ansible).So i ran into an issue when it tries to ensure the environment is running, and i've been at it for a while but cant seem to find my way through:
Might be worth mentioning that the step before it ran into this issue, which i solved by creating the directory manually: