logging

Ignore noisy logs with fluentd in EKS or other Kubernetes clusters

Recently, I decided to use the fluentd-kubernetes-daemonset project to easily ship all logs from an EKS Kubernetes cluster in Amazon to an Elasticsearch cluster operating elsewhere.

The initial configuration worked great out of the box—just fill in details like the FLUENT_ELASTICSEARCH_HOST and any authentication info, and then deploy the RBAC rules and DaemonSet into your cluster, and you're off to the races (assuming your Elasticsearch instance is configured to allow access from the cluster!).

But once I did that, I noticed the brand new EKS cluster was sending over 16,000 log messages per second to Elasticsearch. Doing a tiny bit of analysis (not much was required, honestly), I found that over 98% of the logs were coming from two EKS-specific noisy containers, efs-csi-node and ebs-snapshot-controller.
Follow logs from multiple K8s Pods in a Deployment, ReplicaSet, etc.

For production applications running in containerized infrastructure (e.g. Kubernetes, ECS, Docker Swarm, etc.)—and even for more traditional infrastructure with multiple application servers (for horizontal scalability), it is important to have centralized, persistent logging of some sort or another.

Some services like the ELK/EFK stack, SumoLogic, and Splunk offer a robust feature set for full text searching, filtering, and 'log intelligence'. On the other end of the spectrum, you can use a simple aggregator like rsyslogd or CloudWatch Logs without a fancy system on top if you just need basic central log storage.

But when I'm debugging something in a Kubernetes cluster—especially something like an internal service which I may not want to have logging everything to a central logging system (for cost or performance reasons)—it's often helpful to see all the logs from all pods in a Deployment or Replication Controller at the same time.

You can always stream logs from a single Pod with the command:

How to edit and navigate chunks of a giant text file on Mac/Linux

For most log and text files, simply opening them up in $editor_of_your_choice works fine. If the file is less than a few hundred megabytes, most modern editors (and even some IDEs) shouldn't choke on them too badly.

But what if you have a 1, 2, or 10 GB logfile or giant text file you need to search through? Finding a line with a bit of text is simple enough (and not too slow) if you're using grep. But if you want to grab a chunk of the file and edit that chunk, or split the file into smaller files, there's a simple process that I use, based on this Stack Overflow answer:

Drupal 6.x and PHP 5.3.x - Date Timezone warnings

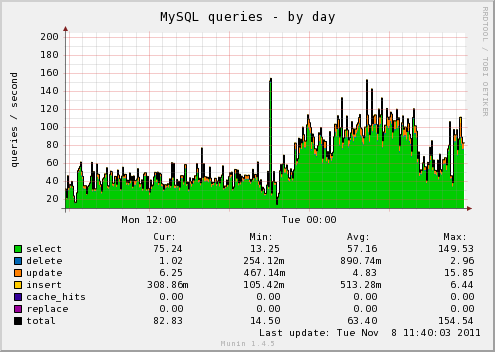
This morning, I was presented with quite the conundrum: one of my servers suddently started having about 4x the normal MySQL traffic it would have in a morning, and I had no indication as to why this was happening; traffic to the sites on the server was steady (no spikes), and I couldn't find any problems with any of the sites.

munin mysql traffic spike

However, after inspecting the Apache (httpd) error logs for the Drupal 6 sites, I found a ton of PHP warnings on almost all the sites. Something like the following: